| Command | CAPCAD_ANALYTICS_RESTRAINT |
| Shortcut | none |
| Ribbon | CapCad tab › Safety panel › Restraint split button › the restraint-analysis item; the same command is also on the Analytics panel |
| Windows | "Road Restraint System Analysis" (modeless: the drawing stays live while it is open) and the "Clear zone cross section" viewer |
| CADs | AutoCAD |
| Also opens | Vertical signage management (CAPCAD_SIGN_MANAGE), Alignment properties (CAPCAD_ALIGNMENT_PROPERTIES), Civil 3D utilities (CAPCAD_CIVIL3D_TOOLS) and Calculations (CAPCAD_CALCULATOR_ROAD, straight on its clear-zone page) |
Answers one question, kilometre by kilometre: does the side slope here call for a barrier? The answer does not come from a ruler on the drawing. It comes from the terrain, the design speed and the traffic volume of the alignment itself, applied to the norm.
- The norm, not an estimate. The clear-zone width comes from the speed × traffic table, widened on curves by the curve factor Kcz; the restraint decision comes from the embankment height × slope table.
- Reads the alignment. Design speed, traffic volume and carriageway width are station-indexed properties of the alignment: a stretch that changes class is analysed with that stretch's numbers. If one is missing, the command offers to set it on the spot.
- Both sides, always. Every station is analysed left and right, with each side's half-width, including the width measured to the kerb lines defined on the alignment.
- The result in the drawing. Each analysed cut is drawn in plan in its verdict colour, with arrows; critical stations get the embankment height marked.
- Shows why. The section viewer shows the whole section across both sides, the shaded clear zone and the crest/toe pair that decided the case, with the measured slope next to the norm's limit.
- Ready for design. Critical stations become guardrail stretches in a table that opens the batch insertion directly, and the clear-zone boundaries are drawn along the whole alignment.
What it does
The clear zone is the roadside strip, measured from the carriageway edge, in which an errant vehicle should be able to stop or regain control without meeting an obstacle or a dangerous slope. The norm of the active country profile defines two things about it, and the command applies both:
- How wide it is. A base width read from a table by design speed and traffic volume, multiplied by the Kcz factor, which widens it on curves: the more, the tighter the radius and the higher the speed.
- Whether the ground inside it calls for restraint. For every crest/toe pair found in the section, the norm gives a minimum slope as a function of the embankment height. Steeper than that, the embankment is not recoverable and restraint is indicated.
The window gathers five jobs over the same alignment and surface:
- Analysis along the alignment (7): cuts a section at every step, on both sides, and grades each side critical (restraint indicated), non-critical embankment or cut/flat. Draws the cuts in plan, produces the Excel report and the guardrail batch table.
- Clear-zone boundaries (5): draws, along the alignment, the carriageway-edge line and the clear-zone line, on both sides.
- Section at a point (23): analyses the clicked side at any station and draws the cut and, if asked, the cross section with a grid.
- Point in the clear zone (28) and interferences (29): tell whether a point, or each block of a selection, lies inside the clear zone.
- Section viewer (41): steps through the analysed sections and computes any other station with a click on the alignment.
What the alignment has to carry
The command uses the project alignment and reads three of its properties, all station-indexed:
| Property | Used for |
|---|---|
VDM |
traffic volume: the column of the base-width table |
VelocidadeDiretriz |
design speed: the row of the base-width table and the column of the Kcz table |
LarguraPista |
total carriageway width; the edge sits at half of it on each side. Not needed when option 20 is ticked and the alignment has kerb lines |
If one of them is missing over the alignment, the command asks, before running, whether to set it now:
- Yes, total extension: asks for one value, stores it for the whole alignment, and the analysis goes on. The design speed is picked from a list of 40 to 120 km/h; the carriageway width accepts 1 to 100 m.
- Yes, segmented: opens Alignment properties to set the property by stretches. Run the analysis again afterwards.
- No: the analysis does not run.
The radius comes from the alignment's geometry at each station.
The surface
The Surface list (16) holds the drawing's Civil 3D surfaces. With more than one, <all> is offered too and analyses them all. Without Civil 3D, the surface is the project's LandXML, shown as <land xml>: the LandXML sample (40) loads one. With neither, the command asks you to select the terrain faces in the drawing (3DFACE or PolyFaceMesh).
Workflow
- Run
CAPCAD_ANALYTICS_RESTRAINT. The window opens beside the drawing. To try it without a project of your own, click LandXML (40): the sample terrain and alignment are loaded and drawn. - Pick the Surface (16) and check the Step (22).
- Pick the outputs: Draw (11), Generate section reports (12), Batch guardrail report (13).
- Click Analyse the section slopes along the alignment (7). If the alignment lacks traffic volume, speed or width, answer the question described above.
- A progress bar follows each element of the alignment. At the end:
- the cuts appear in plan in the verdict colours, and critical stations get the mark
H = <height>; - with (12), Excel opens with the CRESCENTE (increasing) and DECRESCENTE (decreasing) sheets;
- with (13), the stretch table appears in a window and the command asks whether to open the guardrail batch insertion already filled in;
- a message sums up how many sides came out in each verdict, or warns that there are issues to check in the report.
- Click Section viewer (41) to step through the sections and see why each station got its verdict.
- To draw the clear-zone boundaries along the alignment, click Generate the clear-zone boundaries (5).
- To analyse a station off the step, click Analyse the slope at a single section (23) and click beside the alignment, on the side to analyse.
The window
The numbers are the same in every figure on this page: 1 to 41 in the analysis window, 42 to 52 in the section viewer.
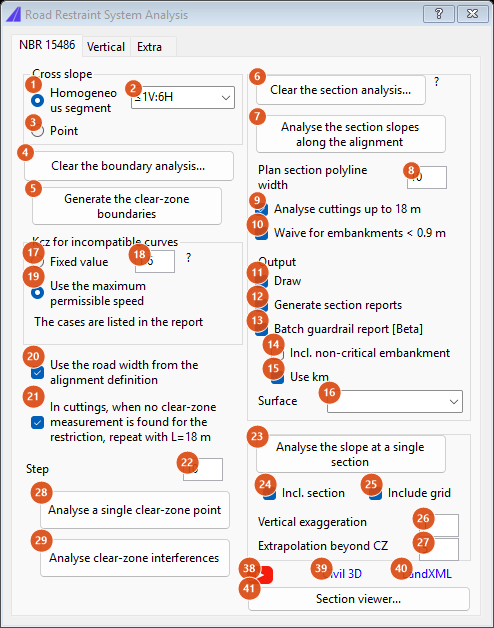
First tab, the window as it opens.
Tab 1
Cross slope (top left frame)
| # | Control | What it does |
|---|---|---|
| 1 | Homogeneous segment | Reference cross slope per segment. Saved with the window; the analysis uses the slope measured in each section. |
| 2 | cross-slope list | Reference band: ≤1V:6H, 1V:5H a 1V:3H, 1V:3H. Saved with the window. |
| 3 | Point | Reference cross slope at a point. Saved with the window. |
| 4 | Clear the boundary analysis… | Erases the lines drawn by Generate the clear-zone boundaries (5), on the layers CAPCAD_ZONA_LIVRE_LIMITE and CAPCAD_ZONA_LIVRE_LIMITE_PISTA. Asks for confirmation, with the option not to ask again. |
| 5 | Generate the clear-zone boundaries | Walks the alignment at the step (22) and, over each stretch, draws the carriageway-edge line (CAPCAD_ZONA_LIVRE_LIMITE_PISTA) and the clear-zone line (CAPCAD_ZONA_LIVRE_LIMITE), on both sides; where the width changes from one stretch to the next, a joining line closes the step. Shows a table with, per stretch: length, radius, Kcz, clear zone, clear zone + half-width on each side, speed, traffic volume and width. The lines are drawn only with Draw (11) ticked. |
Kcz for incompatible curves
The (speed, radius) pair may not exist in the Kcz table: a tight radius at a high speed is not covered by the norm. This frame says what to do then.
| # | Control | What it does |
|---|---|---|
| 17 | Fixed value | Uses the value typed in 18 instead of the table's. The station is flagged in the report. |
| 18 | fixed value | The value used by option 17. Default 1.6. The ? beside it explains the option. |
| 19 | Use the maximum permissible speed | Recomputes with the highest speed that radius allows in the table. The report records the speed used. Default. |
| 20 | Use the road width from the alignment definition | With kerb lines defined on the alignment, each side's half-width is measured at every station, from the alignment to that side's kerb. Without kerb lines, the LarguraPista property applies. |
| 21 | In cuttings, when no clear-zone measurement is found for the restriction, repeat with L=18 m | A side that comes out non-critical embankment is cut again out to 18 m from the edge, and the verdict of that new cut applies. |
With neither option and an off-table pair, the boundary generation (5) shows the pair's speed and radius and offers to open the alignment properties.
Analysis along the alignment (top right frame)
| # | Control | What it does |
|---|---|---|
| 6 | Clear the section analysis… | Erases the cuts, marks and sections drawn by the analysis and by the single-section analysis. Asks for confirmation, with the option not to ask again. The ? beside it explains where the terrain comes from. |
| 7 | Analyse the section slopes along the alignment | Runs the full analysis with the options below. Refuses steps under 1. |
| 8 | Plan section polyline width | Constant width of the polyline of each cut drawn in plan. Default 10. |
| 9 | Analyse cuttings up to 18 m | Saved with the window. The new cut out to 18 m is governed by option 21. |
| 10 | Waive for embankments < 0.9 m | Embankments lower than 0.90 m do not call for restraint. Unticked, they are judged against the table's 0.90 m row. |
| 11 | Draw | Draws in plan the cut of each side at each station, from the carriageway edge to the end of the analysed section, on the verdict's layer (table below), with arrows. Also governs Generate the clear-zone boundaries (5). |
| 12 | Generate section reports | Opens in Excel the CRESCENTE (right side) and DECRESCENTE (left side) sheets, one row per station: alignment, length, status, radius, speed, traffic volume, Kcz, clear zone, restraint, angle (%), identifier of the drawn entity and remarks. Without Draw (11) the identifier column stays empty, and the command says so. |
| 13 | Batch guardrail report [Beta] | Merges the critical stations into guardrail stretches (see From critical stations to guardrail stretches), shows the table and asks whether to open the batch insertion already filled in. Needs an offsetDefensa (36) other than zero. |
| 14 | Incl. non-critical embankment | Sides in non-critical embankment also enter the guardrail stretches. |
| 15 | Use km | Stretches come out in stations (km). Unticked, they come out in E, N coordinates. With station equations on the alignment, km output is refused. |
| 16 | Surface | The analysis terrain: a Civil 3D surface, <all> for all of them, or <land xml>. A typed name that is not in the list is refused and the box is highlighted. |
Layers of the cuts drawn in plan, all with the arrow linetype SETA_CONT_1 and lineweight 0.40:
| Verdict | Layer | Colour |
|---|---|---|
| critical | CAPCAD_ZONA_LIVRE_PLANTA_PONTO_ENCONTRADO_ANGULO_CRITICO |
red |
| non-critical embankment | CAPCAD_ZONA_LIVRE_PLANTA_PONTO_ENCONTRADO_ANGULO_OK |
orange |
| cut or flat | CAPCAD_ZONA_LIVRE_PLANTA_PONTO_NAO_ENCONTRADO |
green |
| no section (the surface does not cover the cut) | CAPCAD_ZONALIVRE_PLANTA_SECAO_NAO_ENCONTRADA |
white |
On every critical side, a point and the text H = <embankment height> mark the toe of the slope, on the critical layer, even with Draw unticked.
Single section (bottom frame)
| # | Control | What it does |
|---|---|---|
| 22 | Step | Distance between analysed stations, in metres. The first station sits one step from the start of the alignment. Values under 1 are refused. Default 10. |
| 23 | Analyse the slope at a single section | Asks Point along the alignment... repeatedly, until Esc. Each click is projected onto the nearest element of the alignment, and only the clicked side is analysed. The cut is drawn on its own layers, with the _INDIVIDUAL suffix and darker colours; a critical side gets the H = mark. A side in non-critical embankment is cut again out to 18 m when option 21 is ticked. A click that does not project onto the alignment shows Not found. |
| 24 | Incl. section | After each point, asks Section insertion point... and draws the cross section there: the terrain, the deciding crest/toe pair with the text <slope>%, H=<height> (<limit>%) and, with extrapolation (27), the two verticals of the clear-zone limits. |
| 25 | Include grid | Adds a 1 m grid to the drawn section, with distances below and elevations on the left. |
| 26 | Vertical exaggeration | Vertical exaggeration of the drawn section. The section rests on the insertion point by its lowest point. Default 1. |
| 27 | Extrapolation beyond CZ | Metres of terrain drawn beyond the clear-zone limit, at both ends of the section. Affects the drawing only; the verdict is still decided inside the clear zone. Default 5. |
| 28 | Analyse a single clear-zone point | Asks for points until Esc and answers, for each one, whether it is inside or outside the clear zone at that station, on the side where it was clicked. Needs a surface. |
| 29 | Analyse clear-zone interferences | Asks for a selection and, for every selected block, checks whether its insertion point lies inside the clear zone. Shows a table with the identifier, True or False, and the block name. Needs a surface. |
Footer
| # | Control | What it does |
|---|---|---|
| 38 | tutorial | Opens the command's video. |
| 39 | Civil 3D | With Civil 3D loaded: opens the sample drawing, with a surface and an alignment, and sets the project alignment from it. |
| 40 | LandXML | In any AutoCAD: loads the sample terrain in LandXML, draws the terrain mesh, sets the sample alignment as the project alignment, draws it and frames the drawing. |
| 41 | Section viewer... | Opens the viewer with the last analysis's sections or, with no analysis, with the first station of the alignment. |
Tab 2: Vertical
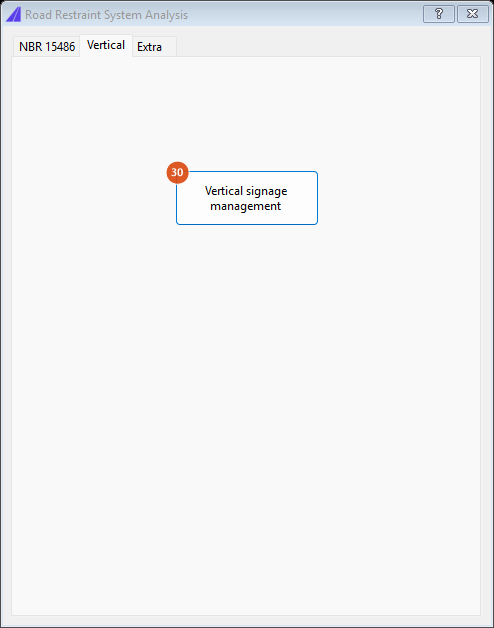
The Vertical tab has a single button.
| # | Control | What it does |
|---|---|---|
| 30 | Vertical signage management | Opens the vertical signage manager already filtered to signs of 6 m² or more, the ones that need a heavy support. A support inside the clear zone is itself an obstacle. |
Tab 3: Extra
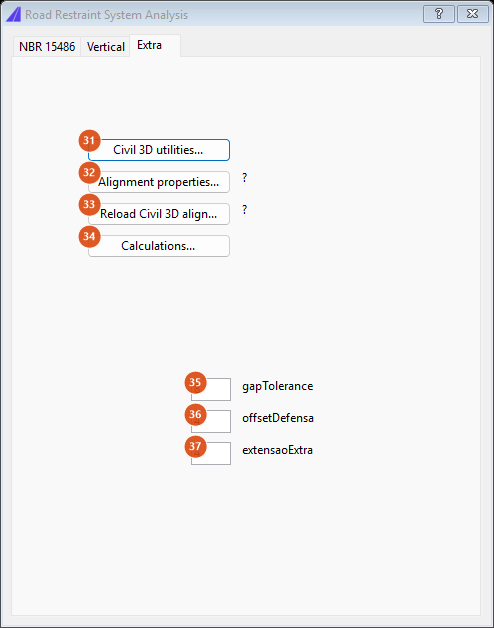
The Extra tab: neighbouring commands and the three numbers that build the guardrail stretches.
| # | Control | What it does |
|---|---|---|
| 31 | Civil 3D utilities… | Opens the Civil 3D utilities. Needs Civil 3D loaded. |
| 32 | Alignment properties… | Opens Alignment properties, to set width, speed and traffic volume, by stretches if needed. |
| 33 | Reload Civil 3D alignment… | Rereads the alignment from the Civil 3D alignment, after you change its geometry or position. If nothing changed, it says so and does not reread. |
| 34 | Calculations… | Opens the road calculator straight on its clear-zone page. |
| 35 | gapTolerance | Largest gap, in metres, between two critical stretches for them to be joined into one. Default 8. |
| 36 | offsetDefensa | Guardrail offset from the alignment, in the table's Afastamento column. The sign comes from the side: positive on the right, negative on the left. Default 4. |
| 37 | extensaoExtra | Extra length, in metres, added at both ends of every stretch. Default 4. |
The section viewer
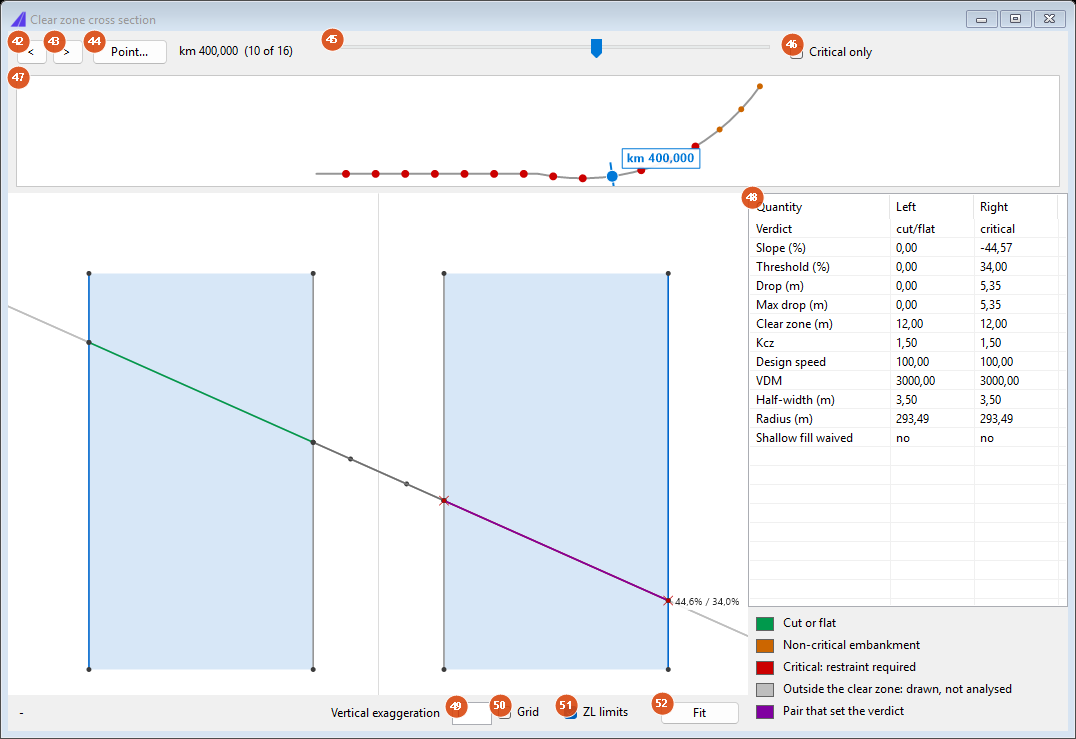
The viewer at a station on a curve: on the right the ground falls away and the side comes out critical, with the deciding pair in purple and "44,6% / 34,0%" (measured slope against the norm's limit); on the left the ground rises and the side comes out cut/flat. The clear zone is shaded blue on both sides. At the top, the alignment with the analysed stations.
The viewer does not write to the drawing. It shows the whole section, from one clear-zone limit to the other across the carriageway, and colours the judged stretch of each side on top of it.
| # | Control | What it does |
|---|---|---|
| 42, 43 | <, > | Previous / next station of the list. |
| 44 | Point… | Click in the drawing beside the alignment: the viewer shows the section at that station, on both sides. Nothing is drawn. |
| 45 | station bar | Jumps to any station of the list. The title shows km <station> (n of N). |
| 46 | Critical only | Narrows the list to stations where one side came out critical. Disabled when there is none. |
| 47 | alignment | The alignment in plan, with each analysed station as a dot in the colour of its worse verdict and the current station marked. Click the alignment to see the section at that point. Dragging with the left button draws a zoom window; the wheel zooms; dragging with the wheel pans; double-clicking the wheel fits everything. |
| 48 | station table | One row per quantity, one column per side: verdict, slope (%, negative = falling), limit (%), drop, maximum drop, clear zone, Kcz, speed, traffic volume, half-width, radius and whether a shallow embankment was waived. |
| 49 | Vertical exaggeration | Multiplies the figure's elevations. The elevation readout in the footer always shows the real value. |
| 50 | Grid | Metric background grid. |
| 51 | ZL limits | Shades each side's clear zone and marks the carriageway edge (grey) and the clear-zone limit (blue). |
| 52 | Fit | Refits the whole section. |
The bar between the alignment and the section can be dragged to give more room to one or the other. The section takes the same mouse as the alignment: dragging with the left button draws a zoom window. With the cursor over the section, the footer shows the offset, the elevation and the distance to that side's edge.
The colours:
| Colour | Meaning |
|---|---|
| green | cut or flat: no drop that matters |
| orange | non-critical embankment: an embankment of 0.90 m or more, not steep enough |
| red | critical: restraint indicated |
| light grey | terrain outside the judged stretch, drawn so you can see the slope continue |
| purple | the crest/toe pair that decided the verdict |
| light blue | the clear zone |
How the options combine
The figures below came out of real runs of the analysis over synthetic terrain, at vertical exaggeration 2. A 7 m carriageway (edge at 3.50 m), design speed 100 km/h, traffic volume 3,000: 8 m of clear zone on each side.
The labels inside the figures are in Portuguese: esquerda is left, direita is right, corte/plano is cut/flat, aterro ok is a non-critical embankment and crítico is critical.
The three verdicts
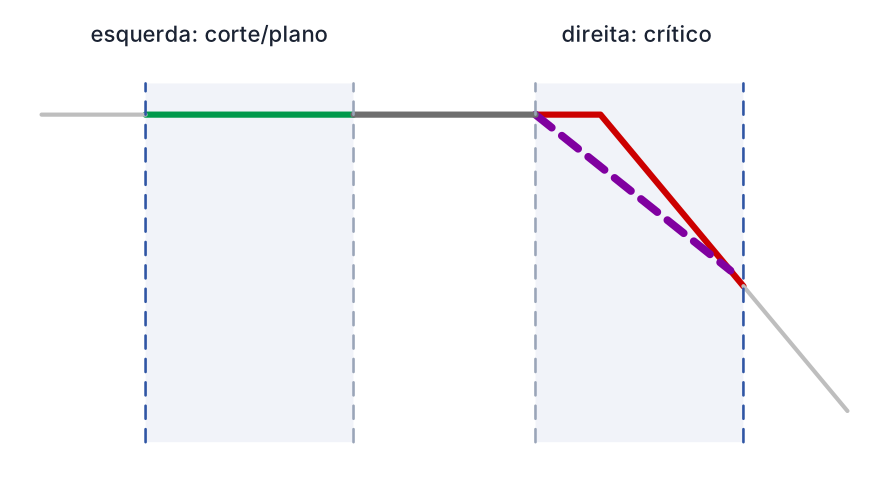
A 60 % slope starting 2.50 m beyond the edge. The crest sits at the edge itself, so the flat shoulder counts towards the horizontal run: the crest/toe pair accumulates a 3.00 m drop over 7.50 m, that is 40 % average slope, not the 60 % of the slope face. The limit the table gives for a 3.00 m drop is below that, so the side comes out critical.
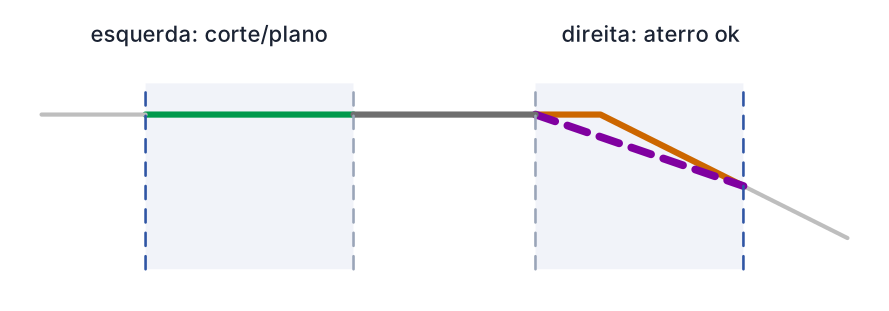
The same terrain at 25 %. The drop reaches 1.375 m over an 8.00 m run, that is 17.2 % average slope, far under what the table asks for at that height: there is an embankment, there is no criticality.
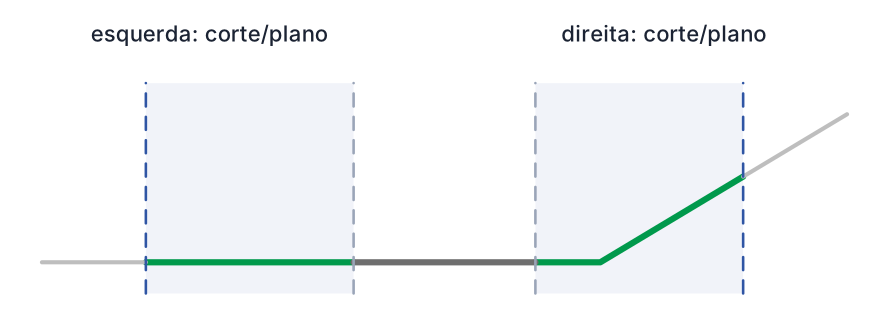
Terrain rising to the right: there is no drop at all inside the clear zone, and the side comes out cut/flat. The left side is flat in all three figures and comes out cut/flat in all three.
How the restraint limit behaves
The table applied is a step function: the higher the embankment, the gentler the slope that already makes it critical. It starts at the lowest height the table covers and levels off at 1V:3H from a certain height upwards. Below the lowest row there is no line at all: that is the shallow embankment waived by option 10.
The comparison is strict: a slope exactly equal to the limit does not call for restraint.
How the clear-zone width behaves
The base width is read from a table by design speed and traffic volume, then multiplied by the curve factor. Two properties of that lookup decide whether you get an answer:
- The speed must be one of the table's rows. A design speed between two rows finds no width: the station is flagged in the report, and on a tangent the clear zone comes out zero.
- The radius is fitted onto a table row before the lookup. Below the tightest row and from the widest row upwards it counts as a tangent, and the curve factor is 1.
The final width is curve factor × base width.
From critical stations to guardrail stretches
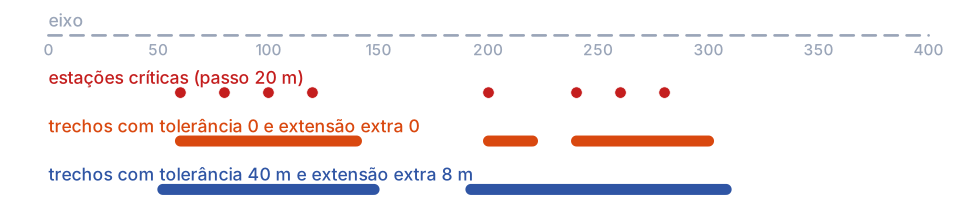
Each critical station covers from its own station to the next station of the step; contiguous ones become a single stretch. Stretches separated by a gap smaller than gapTolerance (35) join, and each stretch gains extensaoExtra (37) at both ends. In the figure, tolerance 40 m and extra 8 m.
Each stretch becomes one row of the table. With Use km (15):
Km ini · Km fim · Afastamento · Ação · Bloco entrada · Bloco saída · Terminal entrada · Terminal saída · Bordo ini · Bordo fim · ZL ini · ZL fim · Cor talude
Without it, the first two columns become E ini · N ini · E fim · N fim.
Ação (action), Bloco entrada/saída (entry/exit block) and Terminal entrada/saída come out as ?: the analysis knows where restraint is needed, not which guardrail nor which terminal. You complete those columns in the batch insertion and draw. Cor talude carries vermelho (red) for a stretch with any critical station and laranja (orange) for a stretch of non-critical embankment only (option 14).
Remembered between sessions
When it closes, the window stores the controls of three frames: the analysis-along-the-alignment frame (8 to 16), the Kcz method and its value (17 to 19) and the single-section frame (24 to 27).
The viewer stores the exaggeration, the grid and the clear-zone limits.
Notes
- Overlapping surfaces. With more than one surface, each section uses the first one that covers the cut.
- The judged section stops at the clear-zone limit. Terrain drawn beyond it is there so you can see the slope continue.
- The guardrail side. The sign of each row's Afastamento states the side: positive on the right, negative on the left, looking in the stationing direction.
- The command has no keyboard shortcut.
ZLis the shortcut ofCAPCAD_MARKING_AREA_LINEAR.