| Command | CAPCAD_REPORTS |
| Shortcut | RT |
| Ribbon | CapCad tab › Manage panel › Output group › Relatórios |
| Category | Manage: Tools |
| Form | GeneralReportsForm — 10 tabs, modeless (the drawing stays live while it is open) |
| Hosts | AutoCAD and ZWCAD generate; BricsCAD, GstarCAD and ARES Commander open the form, but Generate and Open reports folder are not available in them |
| Also opened by | CAPCAD_CAPCLOUD — the same window, opened on the CapCloud tab |
| Related page | Locator and spreadsheet sync (the Spreadsheet tools tab) |
The quantities come out of the drawing, not out of a parallel spreadsheet. Every marking line, sign, guardrail and gantry already carries what has to be counted: a layer with a grammar, block attributes, a position along the alignment. The Reports command reads those entities and builds the spreadsheets.
- No re-typing in between. There is no parallel register to drift out of step with the drawing: change the drawing, change the report.
- One window for the whole project. Longitudinal marking, studs, hand-applied painting, signing, guardrails, gantries and alignment geometry all come out of the same pass.
- Position as a station, not a coordinate. Every row carries the km and the station computed against the project alignment, plus lat/long when a coordinate system is defined.
- Listings and quantities together. Beyond the item-by-item listings, the command groups and sums into the summaries the bill of quantities actually uses.
- Your own templates. The spreadsheets come out filled inside the project's models, not as a raw table.
- Ready-made presets. Whole configurations of listings, input and output saved under a name and reloaded in one click.
What it does
The command opens a window with ten tabs. The first, Main, is where you choose what to list, where to read from and where to write to; the rest hold the options of each report family plus a few support tools.
The reports read the drawing. There is no separate database: the information comes from the entities themselves — the layer name (which in CapCad has a grammar: SINA_HOR_AM_LFO4 already states type, colour and function), the attributes of the sign and support blocks, the constant width of the polylines, the CapGroups, the xdata. Each item's position is measured against the project alignment, which turns a coordinate into a km and a station; and, if the project has a coordinate system defined, into latitude and longitude as well.
It is the last link of the chain described in The CapCad ecosystem — see the "From the drawing to the report" section.
One pass of Generate produces one or more listings (one row per item) and, optionally, summaries (the same rows grouped and summed). Each listing becomes an Excel file, a tab of a single workbook, a text, a native CAD table or a table drawn in model space.
Workflow
- Set the project and the alignment before anything else. The footer of the Main tab shows the state: green when both are defined, orange when one is missing. Without an alignment the command still generates, but the km, station and alignment-property columns come out empty.
- Run
CAPCAD_REPORTS(or typeRT). - On the Main tab, tick the listings (24 to 34) you want. The Guardrails / barriers box lives on the Guardrails tab (101).
- Select the summaries (3) you want alongside them. Each summary depends on the listing that feeds it; if that listing is not ticked, the summary is reported as pending on the status bar.
- Choose the input (4 to 10): the whole drawing, a selection on screen, a rectangular area or a km range.
- Choose the output (11 to 22) and its options — templates, save in the project folder, one workbook with tabs.
- Adjust, if you need to, the options on the specific tabs (General options, Horizontal longitudinal, Horizontal manual, Vertical, Guardrails).
- Click Generate (41). The form hides, a progress bar follows the reading (with a cancel button) and, at the end, the generated files open in Excel.
- The status bar sums up what was produced: how many listings, how many files, in which folder, and what was left pending.
- Open reports folder... (43) opens the project's
Exportsfolder, where the files were saved.
The reports only read the drawing: cancelling halfway leaves nothing half-done. The only outputs that write to the drawing are Drawn table and CAD Table.
The form
Numbers are the same in every screenshot of this page: a single numbering across the nine tabs shown here. The Spreadsheet tools tab has its own page.
The screenshots are of a Portuguese session; the numbering is the same one this page uses. Where the software has an English caption, the tables below quote the English; where the caption is Portuguese in every language, it is quoted and glossed, marked (Portuguese only).
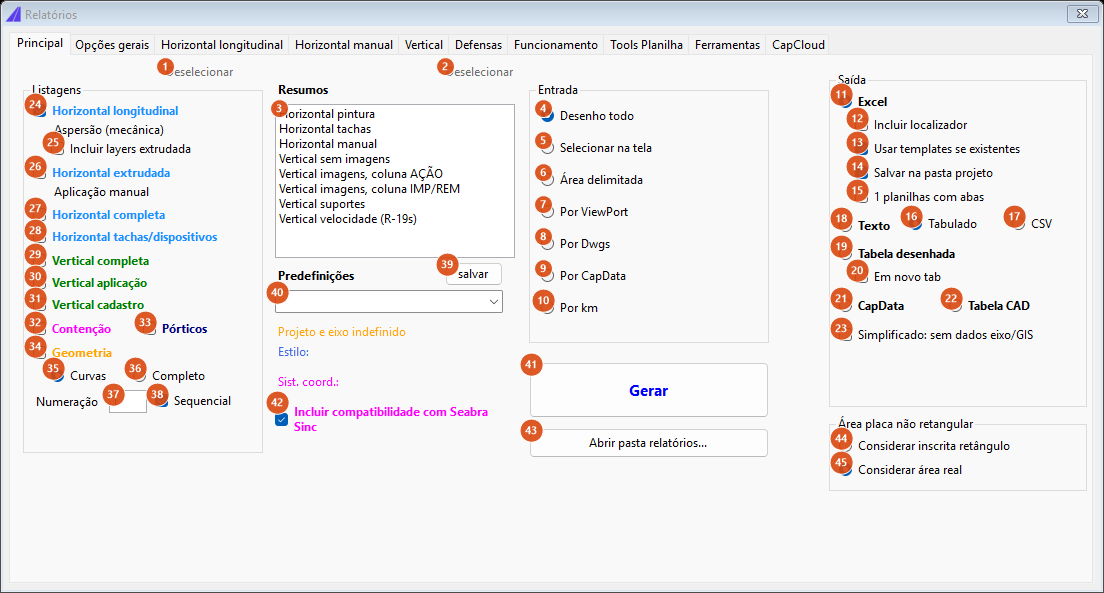
Main tab: listings on the left, summaries and presets in the middle, input and output on the right.
Tab 1: Main — Listings
Each ticked box produces an independent listing, with its own file (or its own tab, in the single-workbook mode).
| # | Control | What it does |
|---|---|---|
| 24 | Horizontal longitudinal (Portuguese only) | One row per horizontal-marking polyline (SINA_HOR), decoded through the layer grammar: type, colour, cadence, dash and gap, action. Length, width and area are computed as described in What each listing produces. |
| 25 | Include extruded layers | Not available in this version: when ticked, the command records "Layers extrudada" as pending on the status bar. |
| 26 | Horizontal extruded | The same: reported as pending when generating. |
| 27 | Horizontal complete | Turns on the hand-applied painting listing (CapGroups and loose items on manual layers). There is no dedicated "horizontal manual" box. "Complete" itself is also recorded as pending. |
| 28 | Horizontal studs/devices | The same generator as the longitudinal one, restricted to the lines that carry a device (stud, raised stud, delineator, cone, super cone). The length here is the gross one, without the cadence factor. |
| 29 | Vertical complete | Every sign in the input, whatever its action. This is the listing that feeds the vertical summaries and the itemised schedule. |
| 30 | Vertical application | Only the signs to be installed. Under one country-specific project paradigm the substitutions (SUB) come with them; otherwise they do not. |
| 31 | Vertical inventory | Only what already exists: signs to remove and signs to keep. |
| 32 | Road restraint | Not available in this version. Ticked, it is always reported as pending. |
| 33 | Gantries | One row per block whose name matches P?RTICO* (so both "PÓRTICO" and "PORTICO"). Note that ticking it both produces the listing and adds "Pórticos" to the pending list at the end of the run — the listing is real; several of its columns come out empty (see below). |
| 34 | Geometry | Geometry report of the project alignment: one file per sub-alignment (curvas.seg1, curvas.seg2, …). It ignores the input choice — it reads the alignment defined in the project. |
| 35 | Curves | Only the curved stretches go into the geometry report. |
| 36 | Complete | The tangents come in too, numbered T1, T2… while the curves are C1, C2… |
| 37 | Numbering | Number of the first row of the geometry report (default 1). |
| 38 | Sequential | On, the numbering carries on from one sub-alignment to the next; off, each sub-alignment restarts at the value in 37. |
| 1 | Deselect (listings) | Clears the ten listing boxes at once. |
Tab 1: Main — Summaries and presets
| # | Control | What it does |
|---|---|---|
| 3 | Summaries | A multiple-selection list. Each summary groups the rows of one listing and sums them; see Summaries. If the source listing was not ticked, the summary appears on the status bar as "requires the listing …". |
| 2 | Deselect (summaries) | Clears the selection in the summaries list. |
| 40 | Presets | Whole named configurations. Choosing one reconfigures the form: testing (whole drawing, Excel, simplified, no templates), production (whole drawing, Excel, with templates), per sheet (drawn table, viewport input), vertical quantities, and three more named after client offices (the four last ones clear the selections, turn on Vertical complete, tick vertical summaries and the single workbook with tabs; the client names are listed on the Portuguese page). Note that per sheet selects the By viewport input, which is not available in this version. |
| 39 | save | Save your own preset: not available in this version; the status bar says "pendente nesta versão". |
| 42 | Include Seabra Sinc compatibility | Ticked, it is recorded as pending when generating. Migrating Seabra files has its own tool on the Tools tab (119). |
Below the preset list are three labels that are information only: the active project and alignment (green when both are defined, orange when the alignment is missing), the project's style and the coordinate system. They are not controls.
Tab 1: Main — Input
Where the entities come from. The alignment geometry reports ignore this choice.
| # | Control | What it does |
|---|---|---|
| 4 | Whole drawing | Sweeps the whole of model space. This is the default. |
| 5 | Select on screen | Asks for a selection in the drawing. |
| 6 | Bounded area | Asks for two corners and uses a crossing-window selection (anything that crosses the area, not only what is wholly inside it). |
| 7 | By viewport | Not available in this version: when you generate, the status bar says so and nothing is produced. |
| 8 | By dwgs | The same. |
| 9 | By CapData | The same. |
| 10 | By km | Sweeps the whole drawing, asks for a start km and an end km and discards what falls outside the range. Each item's km comes from the project alignment; items beyond the perpendicular limit (67) get no km and are left out. |
Tab 1: Main — Output
| # | Control | What it does |
|---|---|---|
| 11 | Excel | Each listing becomes a file. This is the default. |
| 12 | Include locator | Injects into every generated workbook the macro that makes the spreadsheet talk to the drawing — clicking a cell locates the entity in the CAD. An .xlsx has to be rewritten as .xlsm (a macro cannot live in an .xlsx); the status bar reports the swap. See Locator and spreadsheet sync. |
| 13 | Use templates when present | Fills the family's Excel model instead of producing a raw table. See Excel templates. On by default. |
| 14 | Save in the project folder | On, each listing is written to Exports\ inside the project folder. Off, nothing is written to disk: the workbooks only open in Excel, with no file name. |
| 15 | 1 spreadsheet with tabs | Every listing in one workbook, one tab per listing. Templates do not apply in this mode (they are per file). |
| 18 | Text | Instead of writing files, shows the content in a text window you can copy from, paste into Excel or save wherever you like. |
| 16 | Tab-separated | Tab-separated text. |
| 17 | CSV | Comma-separated text. |
| 19 | Drawn table | Draws the table in the CAD as lines and texts (not a table object). Asks for the top-left point. |
| 20 | In a new tab | Before drawing, creates (or recreates) and activates a layout named REPORT-<LISTING NAME>. |
| 21 | CapData | Shows the listing as CapData JSON, in the same text window, to be saved with the .capdata extension. |
| 22 | CAD Table | Inserts a native CAD table at the chosen point: a title row, a header row and the data; row height 1, column width 5, text 0.5. In paper space the table comes out scaled to 20 %. |
| 23 | Simplified: no alignment/GIS data | Forces the geographic and linear columns out, even if they are ticked on the General options tab. This is the fast mode: with no alignment and no lat/long, the reading has no point to project. |
| 44 | Use the bounding rectangle | Non-rectangular conventional signs (circles, diamonds, octagons) are counted with the area of the rectangle that circumscribes them. |
| 45 | Use the real area | The area is that of the actual figure. This is the default. |
| 41 | Generate | Runs everything. |
| 43 | Open reports folder... | Opens the project's Exports folder in Explorer. |
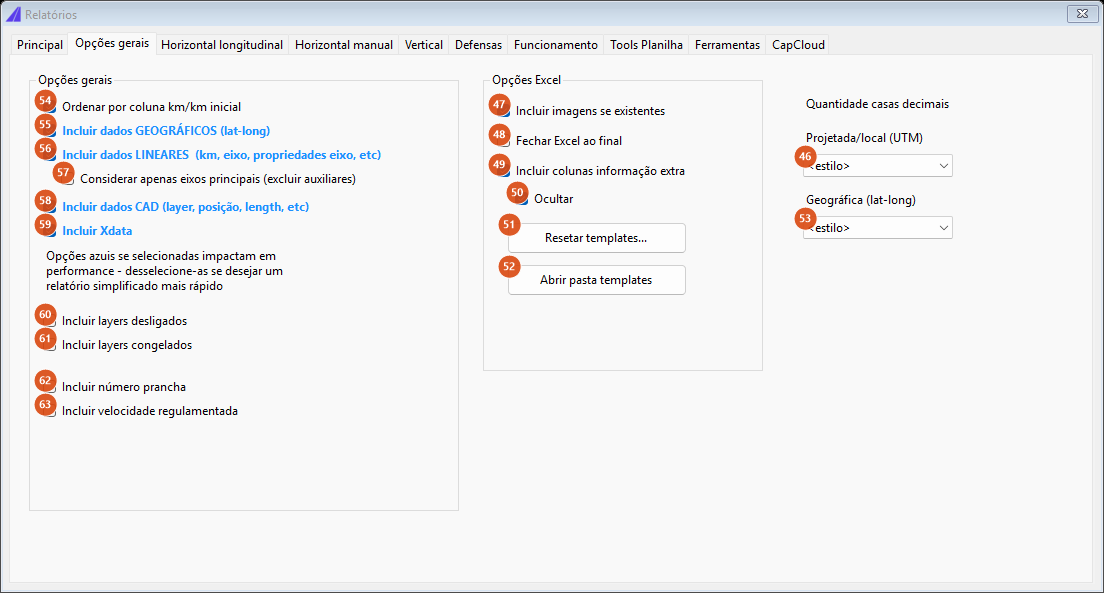
General options tab: what goes into every listing, the Excel options and the decimal places of the coordinates.
Tab 2: General options
The options written in blue on the form are the ones that cost performance: clearing them gives a simpler, faster report.
| # | Control | What it does |
|---|---|---|
| 54 | Sort by the km/start km column | At the end, each listing is sorted by its km column — start km in the horizontal listing, in the studs and in the guardrails; centroid km in the hand-applied painting; km in the vertical listings and in the gantries. Curves and summaries are not sorted. The sort happens before the summaries, so they inherit the order. On by default. |
| 55 | Include GEOGRAPHIC data (lat-long) | Fills latitude and longitude by converting the drawing coordinates through the project's coordinate system. With no system defined the columns come out empty. |
| 56 | Include LINEAR data (km, alignment, alignment properties, etc) | Turns on the measurement against the alignment: km, station and alignment name. Off, the alignment is not even loaded. |
| 57 | Use main alignments only (exclude auxiliaries) | Not available in this version: reported as pending when generating. |
| 58 | Include CAD data (layer, position, length, etc) | The layer and position columns always come out. |
| 59 | Include Xdata | The same. |
| 60 | Include layers that are off | Not available in this version: reported as pending. |
| 61 | Include frozen layers | The same. |
| 62 | Include the sheet number | The same. |
| 63 | Include the posted speed | The same — the posted speed reaches a spreadsheet today only through the Vertical speed (R-19s) summary. |
| 47 | Include images when present | Would embed the sign's picture in the workbook (the .jpg with the same name and folder as the sign's .dwg). Inserting images is not available in this version; the box is saved with the form. |
| 48 | Close Excel at the end | Off (the default), the generated workbooks open visibly in Excel at the end — that is the result you expect to see. On, they stay on disk only. |
| 49 | Include extra information columns | On by default. Today the informative columns always come out; what narrows the workbook is the Hide option below. |
| 50 | Hide | With templates on, restricts the Horizontal longitudinal workbook to a reduced set of columns (alignment, road code, type, colour, position, width, start and end km/lat/long, length, linear area, description, normalised layer, CAD ID, stud material and paint material). No effect on the other listings. |
| 51 | Resetar templates... (Portuguese only: "reset templates") | Deletes the downloaded Excel models. See Excel templates and the reset. |
| 52 | Abrir pasta templates (Portuguese only: "open templates folder") | Opens Exports\reports\ in Explorer. |
| 46 | Projected/local (UTM) | Decimal places of the X and Y columns: <estilo> (leave as the report emitted it), 0, 1 or 2. |
| 53 | Geographic (lat-long) | Decimal places of the latitude and longitude columns: <estilo>, 5, 6 or 7. |
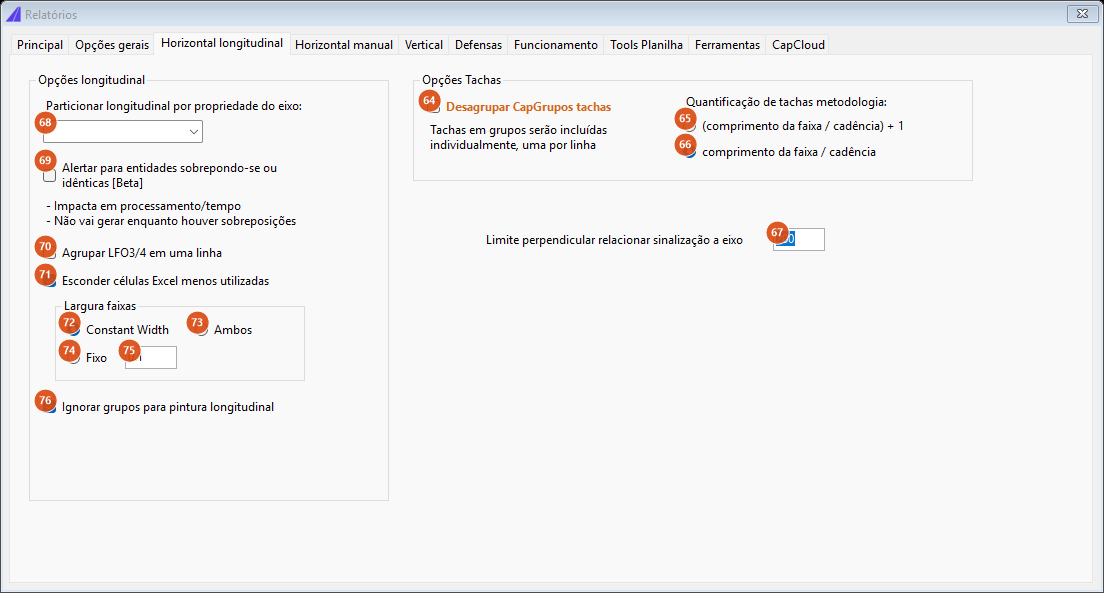
Horizontal longitudinal tab: the options of the longitudinal painting, of the studs, and the perpendicular limit to the alignment.
Tab 3: Horizontal longitudinal
| # | Control | What it does |
|---|---|---|
| 68 | Partition the longitudinal by alignment property | The list of the alignment's station-indexed properties. Not available in this version: when filled, it is reported as pending. |
| 69 | Alert for overlapping or identical entities [Beta] | Not available in this version: reported as pending. The form warns that it costs processing and that it would not generate while overlaps existed. To check duplicates today, use the buttons on the Tools tab (110, 116). |
| 70 | Group LFO3/4 in one row | Not available in this version: reported as pending. |
| 71 | Hide the less-used Excel cells | On by default; saved with the form; not used by this version. |
| 72 | Constant Width | Each line's width is the polyline's constant width. This is the default and the only mode applied in this version. |
| 74 | Fixo (Portuguese only: "fixed") | A fixed width for every line, the value in 75. Selected, it is reported as pending. |
| 75 | fixed-width value | Default 0.1. |
| 73 | Ambos (Portuguese only: "both") | The same: reported as pending. |
| 76 | Ignore groups for longitudinal painting | On by default; saved with the form; not used by this version (the longitudinal listing already ignores the CapGroups). |
| 64 | Ungroup stud CapGroups | Not available in this version: reported as pending. On, studs inside groups would come out one per row. |
| 65 | (comprimento da faixa / cadência) + 1 (Portuguese only: "(line length / cadence) + 1") | Device counting method: add one unit to the result of the division (count both ends). |
| 66 | comprimento da faixa / cadência (Portuguese only: "line length / cadence") | Without the extra unit. This is the default. |
| 67 | Perpendicular limit for tying signing to an alignment | The maximum distance, in drawing units, between the item and the alignment for it to receive a km and a station. Default 200. Beyond it the item has no km — and, on the By km input, is left out of the report. |
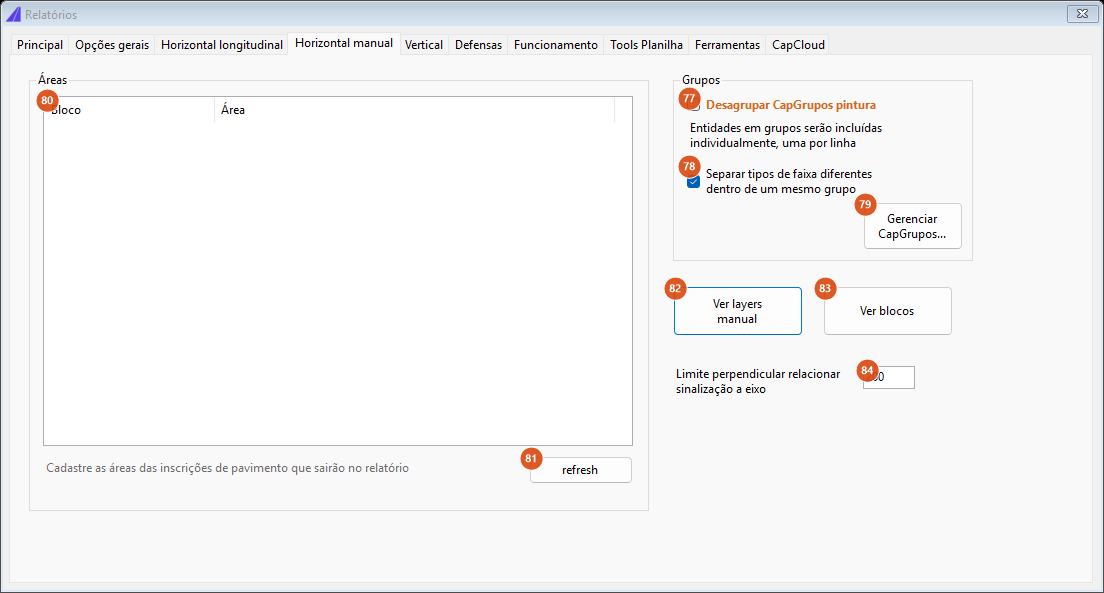
Horizontal manual tab: the register of pavement-legend areas and the CapGroup options.
Tab 4: Horizontal manual
| # | Control | What it does |
|---|---|---|
| 80 | Áreas (list) (Portuguese only: "areas") | The register of the areas of the pavement-legend blocks. The list is read from areas.config, in the project's pavement-legend folder; every new .dwg found in that folder is added with a blank area. Double-click a row to edit it: a box opens with one field per colour (white, yellow, green, blue, red, black). If only white is filled in, the value is stored as a plain number; if more than one colour is filled in, it is stored per colour. |
| 81 | refresh | Re-reads areas.config and the folder. |
| 83 | Ver blocos (Portuguese only: "see blocks") | Opens the project's pavement-legend folder in Explorer. |
| 82 | Ver layers manual (Portuguese only: "see manual layers") | Shows the list of the manual family's layers: the ones from the layer catalogue (manual, chevron hatch, channelisation, conflict area, pedestrian crossing, in both colours) plus the literals LERV, LRV, LRE, MCC, MAE, MCF, LDP and MER. The names come out in the language of the active country profile. |
| 77 | Ungroup painting CapGroups | Not available in this version: reported as pending. |
| 78 | Separate different line types within the same group | On (the default), a CapGroup with different layers produces one row per layer; off, the group becomes a single row. |
| 79 | Gerenciar CapGrupos... (Portuguese only: "manage CapGroups") | Opens CapCad's named-selection manager, where the groups can be renamed and re-selected. |
| 84 | Perpendicular limit for tying signing to an alignment | The same limit as 67, but applied to hand-applied painting only: the maximum distance from the group's centroid to the alignment for it to receive a km. Default 200. |
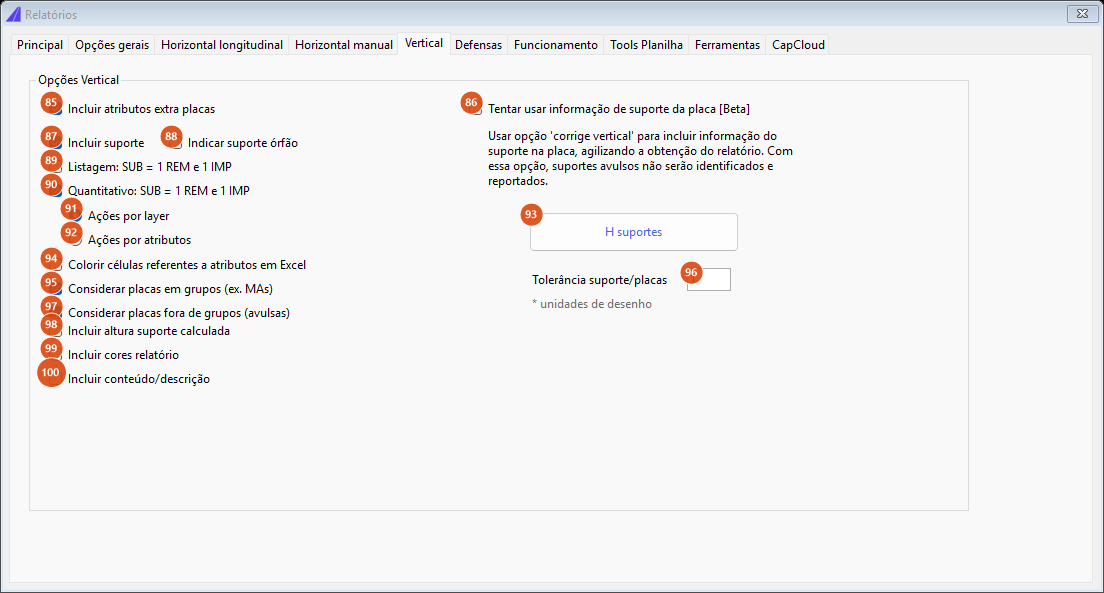
Vertical tab: what goes into the sign listings and how the signs are tied to their supports.
Tab 5: Vertical
| # | Control | What it does |
|---|---|---|
| 85 | Include extra sign attributes | On by default; the vertical listings then carry every attribute of the sign block, one per column. Cleared, it is reported as pending. |
| 87 | Include support | On (the default), the command also reads the support blocks and pairs them with the signs by position, adding the support columns (type, action, quantity, description, layer, CAD ID) and replacing the row's X/Y position with the post's position. Off, the report comes out with the signs alone. |
| 88 | Flag orphan supports | A support no sign claimed. Whatever this box says, the orphans are listed on the status bar by their handle whenever Include support is on. |
| 96 | Support/sign tolerance | The maximum distance, in drawing units, between the sign's point and the support's point for them to count as the same assembly. Default 1. |
| 89 | Listing: SUB = 1 REM and 1 IMP | Would split each substitution into two rows in the listing itself. Ticked, it is reported as pending. |
| 90 | Quantities: SUB = 1 REM and 1 IMP | On by default: in the summary, each substitution counts as one removal plus one installation. Cleared, it is reported as pending. |
| 91 | Ações por layer (Portuguese only: "actions by layer") | The action (install, keep, remove, substitute) is read from the sign's layer. This is the default. |
| 92 | Ações por atributos (Portuguese only: "actions by attribute") | Would read the action from the attributes. Ticked, it is reported as pending. Under one country-specific project paradigm the generator already uses the action attribute on its own, whatever these radios say. |
| 94 | Colour attribute cells in Excel | Not available in this version: reported as pending. |
| 95 | Include signs in groups (e.g. MAs) | Brings in the signs of the grouped-message families. On top of that, it makes the command walk the leftover supports looking for the tag of the group they belong to, so they can be reported under their group instead of as orphans — this is the slow half of the reading. |
| 97 | Include signs outside groups (standalone) | The complement: the signs that are not part of a grouped-message family. The two boxes partition all the signs, so they are never both off — clearing one while the other is already off turns the other back on. Both always open ticked, even if the previous session left them otherwise. |
| 98 | Include the calculated support height | Not available in this version: reported as pending. To compute support heights, use H suportes (93). |
| 99 | Include report colours | Not available in this version: reported as pending. |
| 100 | Include content/description | Not available in this version: reported as pending. |
| 86 | Try to use the sign's support information [Beta] | Would use the support data already written on the sign instead of pairing by position, which is faster but stops identifying standalone supports. Ticked, it is reported as pending. |
| 93 | H suportes (Portuguese only: "support heights") | Runs CAPCAD_ANALYTICS_SIGN_POST_HEIGHT, the support-height calculation. |
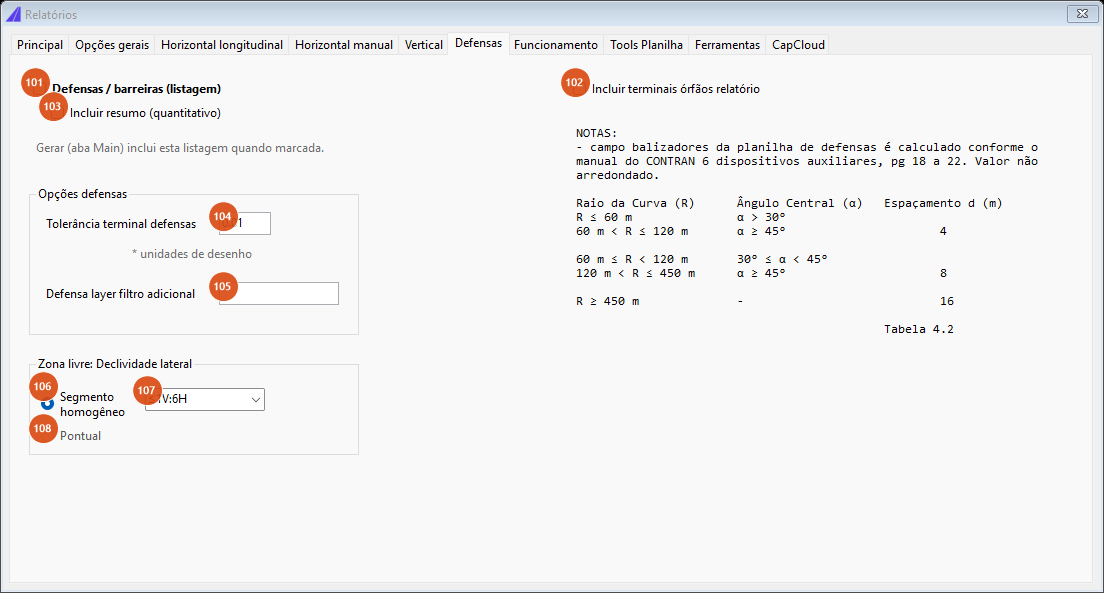
Guardrails tab: the box that turns the guardrail listing on lives here, together with its options.
Tab 6: Guardrails
Careful: the box that turns the guardrail listing on is not on the Main tab, it is here. The label under it says so.
| # | Control | What it does |
|---|---|---|
| 101 | Guardrails / barriers (listing) | One row per stretch of metal guardrail or concrete barrier found in the input. Recognised layers: those that contain DEFENSA, DEF_ or BARREIRA and an action suffix (_IMP, _MAN, _REM, _SUB). |
| 103 | Include summary (quantities) | Adds the quantities: the rows grouped by item (guardrail or barrier) and action, with the lengths summed and the stretches counted. |
| 104 | Guardrail terminal tolerance | The maximum distance, in drawing units, between the terminal's insertion point and the guardrail for them to be related. Default 0.01. Pairing terminals is not available in this version. |
| 105 | Extra guardrail layer filter | One more layer to treat as a guardrail. Filled in, it is reported as pending when generating. |
| 102 | Include orphan terminals in the report | Not available in this version: reported as pending. |
| 106 | Segmento homogêneo (Portuguese only: "homogeneous segment") | The clear-zone evaluation mode. This is the default. |
| 107 | Declividade lateral (Portuguese only: "side slope") | The side-slope band: ≤1V:6H, 1V:5H a 1V:3H or 1V:3H. Saved with the form; not used by this version. |
| 108 | Pontual (Portuguese only: "point") | Disabled in this version. |
The notes panel on the right is a fixed Portuguese text, the same whatever the active country profile: it reproduces the delineator-spacing-in-curves table (radius, central angle, spacing 4 / 8 / 16 m) and cites the auxiliary-devices manual it was taken from. The delineator field of the guardrail spreadsheet is computed from that table, without rounding. Readers outside that manual's jurisdiction should check the figure against their own regulator's spacing rule.
How it works tab: informative text, no controls.
Tab 7: How it works
It has no controls: it is the command's notice page, as text (in Portuguese). It is worth reading, because it explains decisions you see in the result:
- OneDrive sometimes locks the downloaded spreadsheet models; if that happens, turn it off.
- Some Excel messages open behind the CAD and stall the progress bar. If it seems stuck, look for the Excel window.
- If a workbook looks inconsistent, use Resetar templates....
- Excel must be installed.
- Two kinds of item go into the markings and legends: registered blocks (those in the project's pavement-legend folder, with a pre-set area) and blocks whose name starts with
LEGENDA_(with no area); and CapCad named selections, whose area comes from open or closed entities with a width (linear area = length × width) or from hatches (the hatch's own area). Closed entities without a width are ignored — which is the case for the construction outlines of pedestrian crossings. - In gantries, only blocks named
PORTICO*are listed; the rest needs editing afterwards. - In curves, one report comes out per sub-alignment.
- In the vertical listings, images are inserted when a
.jpgexists with the same name and folder as the sign's.dwg.
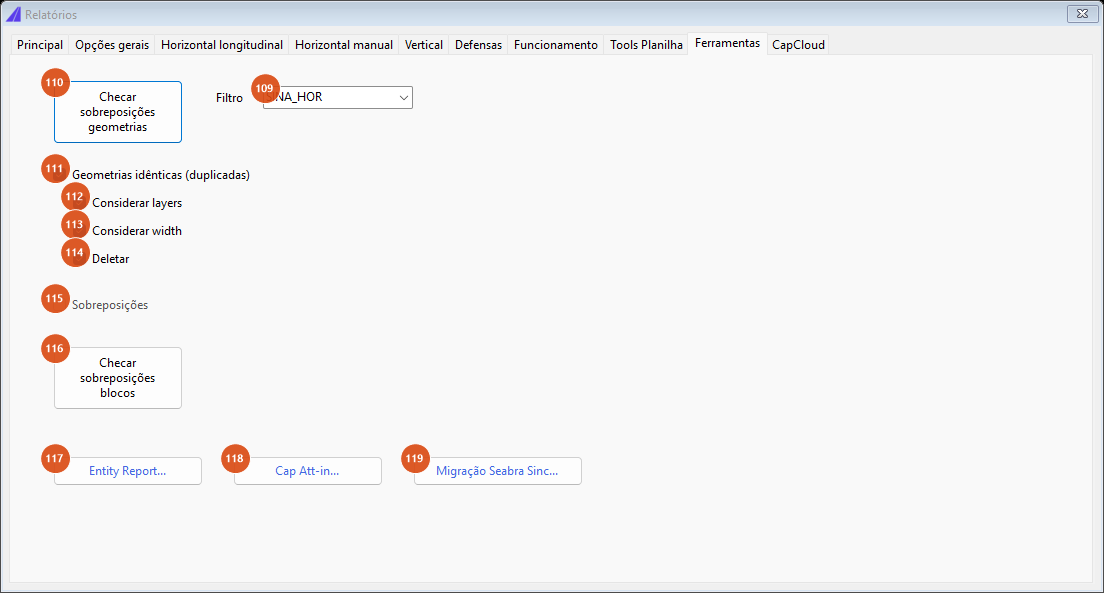
Tools tab: duplicate checking and shortcuts to the neighbouring commands.
Tab 9: Tools
| # | Control | What it does |
|---|---|---|
| 110 | Checar sobreposições geometrias (Portuguese only: "check geometry overlaps") | Asks for a selection (filtered by the layer in 109) and looks for identical curves: it compares segment by segment, in both directions, with the bulges. It reports what it found. |
| 109 | Filter | A layer wildcard applied to the selection: empty, SINA_HOR (the default) or DEFENSA. The text is used as *filter*. |
| 111 | Identical geometries (duplicates) | The comparison mode. On by default. |
| 112 | Consider layers | Two identical curves on different layers do not count as duplicates. On by default. |
| 113 | Consider width | The same for the constant width. On by default. |
| 114 | Delete | Deletes the duplicates found, leaving one. On by default. |
| 115 | Overlaps | Disabled in this version (partial overlap, not duplication). |
| 116 | Checar sobreposições blocos (Portuguese only: "check block overlaps") | Looks for repeated blocks: the same key of name, XYZ position, rotation and scale. |
| 117 | Entity Report... | Runs CAPCAD_REPORT_ENTITY, the generic entity report. |
| 118 | Cap Att-in... | Opens the form that imports spreadsheet data into the drawing (block attributes, dynamic properties, texts, layers). See Locator and spreadsheet sync. |
| 119 | Migração Seabra Sinc... (Portuguese only: "Seabra Sinc migration") | Opens the tool that migrates sinC/Seabra files to CapCad's conventions. |
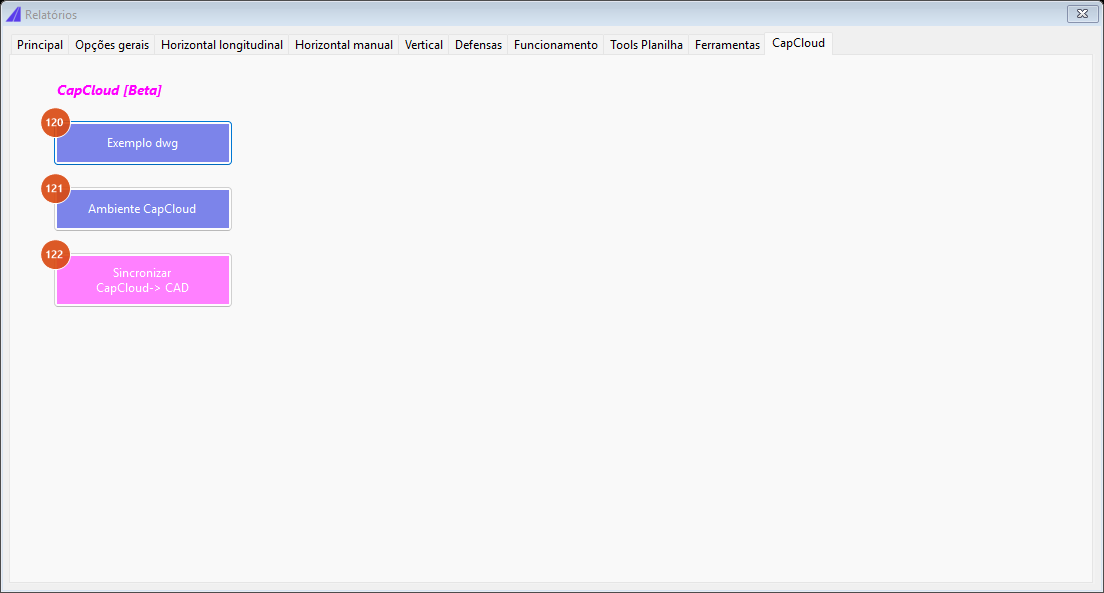
CapCloud tab: the sample drawing and the sync with the cloud register.
Tab 10: CapCloud
This is the tab CAPCAD_CAPCLOUD opens directly.
| # | Control | What it does |
|---|---|---|
| 120 | Exemplo dwg (Portuguese only: "sample dwg") | Downloads a sample drawing from the server into the installation's Exports folder, opens it and sets its project and alignment for you. It is there so you can try the commands out without a real project. |
| 121 | Ambiente CapCloud (Portuguese only: "CapCloud environment") | Explains what the sample data load is and opens capcad.io/pt-BR/Map/signs in the browser. |
| 122 | Sincronizar CapCloud→ CAD (Portuguese only: "sync CapCloud → CAD") | Brings the sign data down from the CapCloud register and applies it to the drawing, matching the "CAD ID" column against the entity handle; it writes retroreflectivity into the matching attribute and as xdata. At the end it shows a report of what changed. |
What each listing produces
The columns below are the ones the generator emits. What ends up in the final workbook still passes through the style's column composer (see The variable vocabulary) and, where there is a template, through the Excel model.
Horizontal longitudinal
One row per horizontal-marking polyline.
| Column | Content |
|---|---|
hor.tipo |
The marking's code, read from the layer (LFO, LMS, LBO…). |
hor.cor |
The colour, read from the layer (white, yellow…). |
hor.layer.normalizado |
The entity's layer name. |
hor.cadencia, hor.traco, hor.espacamento, hor.traco.espacamento |
The dash cadence and its two numbers. |
hor.fator |
The painted fraction of the length: dash ÷ (dash + gap). It is 1 on a continuous line. |
hor.comprimento.entidade |
The polyline's gross length. |
hor.comprimento |
Length × factor — the length actually painted. |
hor.largura |
The polyline's constant width. It is left blank when it is zero, and the area is then blank too. |
hor.area.linear |
Width × painted length. |
hor.acao |
The action, read from the layer suffix; with no suffix, IMP. |
hor.descricao |
The code's description from the built-in marking catalogue — one fixed table, not switched by the active country profile; an unknown code returns the code itself. |
hor.refletividade |
The column comes out empty. |
tacha, tachão, balizador, cone, super cone |
The estimated count of each device: length ÷ the device's cadence (+ 1 depending on the method chosen in 65/66). |
placa.bloco.cad.id |
The entity's handle in the CAD. |
sys.filename, eixo.nome |
File and alignment. |
pos.km.inicial, pos.km.final, pos.lat/lon.inicial, pos.lat/lon.final |
The position of the two ends. |
Horizontal studs/devices
The same columns, with two differences: hor.comprimento holds the gross length (without the cadence factor) and hor.descricao comes out in the form DESCRIPTION-TACHA-COLOUR (or -TACHAO-, -BALIZADOR-). Only the lines that carry a device are included.
Horizontal manual (hand-applied painting)
One row per CapGroup × layer, plus one ITEM AVULSO row for every entity on a manual layer that is not in a group. Columns: hor.layer.normalizado, hor.acao (spelled out), hor.descricao (the group's name; conflict area when the layer is MAC), hor.tipo, hor.cor, hor.material, cad.id, hor.area.linear, hor.area.hachura, hor.area, tacha, tachao, hor.baliza, and the centroid's position (pos.x/y.centroide, pos.km.centroide, pos.estaca.centroide). The loose-item rows also carry hor.posicao (the side, D/E, read from the layer suffix), hor.comprimento and hor.largura.
Vertical
One row per sign. Besides every attribute of the block, one per column named after the attribute:
| Column | Content |
|---|---|
placa.acao |
IMP / MAN / REM / SUB / RMJ, from the layer (or from the action attribute under the country-specific paradigm). |
placa.bloco.cad.id |
The sign's handle. |
sys.filename, eixo.nome, projeto |
File, alignment and project name. |
placa.bloco.layer, placa.bloco.nome, placa.codigo, placa.tipo |
Layer, block, code and type (warning, regulatory, information…). There is also a second, composite code column whose key is named after a national road authority; it is listed on the Portuguese page. |
placa.posicao |
TERRESTRE (ground-mounted), or AÉREO when the support is a gantry. |
placa.substrato.material, placa.substrato.pelicula |
Substrate and sheeting. |
placa.dimensoes, placa.largura, placa.altura, placa.area |
On conventional signs, computed from the nominal size (width and height come out as "-"); on custom ones, from the "LxA" attribute. |
pos.km, pos.estaca, pos.lat, pos.lon |
The sign's position. |
metodo_aquisicao |
How the row was assembled: PLACA -> SUPORTE or SUPORTE -> PLACAS (agrupado). |
suporte.acao, suporte.tipo, suporte.quantidade, suporte.descricao, suporte.bloco.layer, suporte.bloco.cad.id |
From the paired support. With no support, the quantity comes out ?. |
pos.x, pos.y, pos.km_calculado |
The post's position, when there is a support: it overwrites the sign's position. |
The only difference between the three vertical listings is the action filter: application brings what is to be installed, inventory brings what exists (remove and keep), complete brings everything.
Guardrails
| Column | Content |
|---|---|
def.item |
DEFENSA (guardrail) or BARREIRA (barrier), from the layer. |
def.acao |
IMPLANTAR / MANTER / REMOVER / SUBSTITUIR, from the layer suffix. |
def.layer |
The entity's layer. |
def.curva_ou_reta |
CURVA when the stretch has curvature, RETA when it does not. |
def.comprimento |
The stretch's length. |
pos.x/y.inicial, pos.x/y.final |
The two ends. |
The summary groups by item and action, sums def.comprimento and counts the stretches in qtd.
Gantries
nr, pos.km, pos.lat, pos.lon, portico.tipo (the effective block name) and cad.id. The columns portico.vao.horizontal, portico.altura.livre and portico.defensas exist but come out empty — they need editing in the spreadsheet.
Geometry (curves)
One report per sub-alignment. One row per alignment segment: with Curves, only the curved stretches; with Complete, the tangents too.
| Column | Content |
|---|---|
nr |
C1, C2… on the curves and T1, T2… on the tangents (Complete mode); in Curves mode, just the sequential number. |
pos.xy.inicial, pos.xy.final |
The coordinates of the ends. |
pos.km/estaca/lat/lon start and end |
The position of the ends. |
curva.extensao |
The stretch's length. |
curva.classificacao |
tangente, curva or curva acentuada (sharp curve) — a deflection greater than 30° and a radius smaller than 120 m. |
curva.raio, curva.angulo.interno, curva.lado |
Radius, central angle and side (ESQ / DIR, left / right). |
curva.centro, curva.angulo.inicial, curva.angulo.final |
The arc's centre and the centre-to-end angles. |
curva.piv |
The PI: the intersection of the entry and exit tangents. |
curva.defensa, curva.delineador, hor.material, placa.codigo, curva.zoom |
Columns to fill in the spreadsheet; they come out empty. |
Summaries
Each summary depends on a listing.
| Summary | Depends on | What it does |
|---|---|---|
| Horizontal painting | Horizontal longitudinal | Groups by type, colour and width; sums the linear area; adds a QTD column. |
| Horizontal studs | Horizontal studs | Groups by type, description, colour and reflectivity; sums the stud and raised-stud counts. No quantity column. |
| Horizontal manual | Horizontal complete (hand-applied painting) | Groups by code, description and action; sums the area; QTD column. |
| Vertical without images | Vertical complete | First produces the itemised schedule: each substitution becomes one installation and one removal (the "keep" rows drop out). Then it groups by code and area, summing the total area and the IMP and REM counts. It produces two listings: the schedule and the summary. |
| Vertical images, AÇÃO column | Vertical complete | Not available in this version: reported as pending. |
| Vertical images, IMP/REM column | Vertical complete | The same. |
| Vertical supports | Vertical complete | Splits the substitutions and groups by support type, with the quantity. |
| Vertical speed (R-19s) | Vertical (any) + alignment | Takes the speed-limit signs that have a support, projects the post's point onto the alignment and builds the table of posted speed by km, split into increasing and decreasing direction. When two of them fall on the same rounded km, the last one wins. |
Ticking Vertical without images, Vertical images (AÇÃO) or Vertical images (IMP/REM) makes the Vertical complete listing clean the code name for the quantities; with those or with Vertical supports, the speed-limit signs' code starts carrying the speed.
The variable vocabulary
Every CapCad report column has a dotted name: placa.codigo, hor.area.linear, def.comprimento, pos.km.inicial, suporte.secao. It is not decoration: it is one vocabulary, shared by three places in the program.
- The report generators emit their rows using those names as column keys.
- The style editor's report composer uses the same names to decide, per style, which columns appear, with what label, in what order and in what format. This is the column catalogue: each entry defines the name (
placa.codigo), the visible label ("Código"), the data type (text, real, area, km, geographic, date…) and the format (0.00,0+000,0.000000). - The property sets (the properties the entities carry) start from the same list.
The catalogue is organised by report family: Vertical, Horizontal, HorizontalManual, Segurança (guardrails), Tachas (studs), Porticos (gantries) and CurvasTratamento (curves). The prefixes you meet most:
| Prefix | Family | Examples |
|---|---|---|
pos. |
Position, common to everything | pos.km, pos.estaca, pos.lat, pos.lon, pos.x, pos.y, and the .inicial / .final / .centroide variants |
eixo. |
Alignment data | eixo.nome, eixo.velocidade.regulamentada, eixo.pista.nome, eixo.viario.sentido |
placa. |
Vertical signing | placa.acao, placa.codigo, placa.tipo, placa.area, placa.substrato.pelicula, placa.orla.cor, placa.si |
suporte. |
Supports | suporte.tipo, suporte.secao, suporte.altura, suporte.quantidade, suporte.acao |
conjunto. |
Sign + support paired | conjunto.placa.cad.id, conjunto.suporte.cad.id |
hor. |
Horizontal marking | hor.tipo, hor.cor, hor.largura, hor.comprimento, hor.area, hor.cadencia, hor.tacha.refletividade |
def. |
Guardrails and barriers | def.item, def.tipo, def.modelo, def.lado, def.comprimento, def.laminas, def.balizadores, def.terminal.inicial |
curva. |
Alignment geometry | curva.raio, curva.angulo.interno, curva.classificacao, curva.piv |
portico. |
Gantries | portico.tipo, portico.vao.horizontal, portico.altura.livre |
sys. |
Metadata | sys.filename, sys.filepath, sys.user, sys.datetime |
What that means in practice: the spreadsheet's layout is a decision of the project's style, not of the command. Changing the style can change which columns appear and how, without touching the drawing or the report. And if a column comes out empty in your workbook, the reason is usually one of two: either that column is not filled in this version, or the drawing does not carry the data.
Excel templates and the reset
With Use templates when present (13) on, a listing does not go into a raw table: it is poured into an already-formatted .xls model, starting at the first data row.
| Listing | Model |
|---|---|
curvas.segN |
Curvas Tratamento.xls |
horizontal.longitudinal |
Projeto Marcas Longitudinais.xls |
horizontal.tachas |
Projeto Tacha Tachão.xls |
vertical.* |
Projeto Sinalização Vertical.xls |
horizontal.manual |
Projeto Canalizacao e Inscricoes Pav.xls |
defensas |
Projeto Defensas.xls |
porticos |
Projeto Pórticos e Semipórticos.xls |
The summaries have no model: they always come out as a plain sheet.
The models are downloaded from the server once, on demand, into Exports\reports\capcad.default\ inside the project folder, and reused from there on. The row where the data starts is 12, with two exceptions: 13 in Marcas Longitudinais and 14 in Tacha Tachão. If the project's style declares a start row of its own, that one wins.
If a model cannot be obtained or filling it fails, the command says so on the status bar and falls back to a plain sheet — the report comes out either way.
When the workbook comes out with odd data
An Excel crash can corrupt a downloaded model, and from then on every workbook of that family comes out wrong — with data that has nothing to do with the drawing. The fix is Resetar templates... (51), on the General options tab:
- Click Resetar templates....
- The command explains that the operation risks no data loss and offers three answers: Yes, Back and See folder (which only opens
Exports\reports\in Explorer so you can look). - On confirming, every
.xls*in the folder is deleted and the command reports how many were removed. - On the next run, the models are downloaded again from the server, intact.
It is the same fix described in the Troubleshooting guide.
Where the files are written
With Save in the project folder (14) on, each listing becomes Exports\<listing name>.xls (or .xlsx, when there is no model) inside the project folder — vertical.completa.xls, horizontal.longitudinal.xls, defensas.xls, curvas.seg1.xls, and so on. In the single-workbook mode everything goes to Exports\relatorios.xlsx.
With no project defined, the destination is the system's temporary folder.
With the box off, nothing is written: the workbooks only open in Excel, with no file name, for you to save where you like.
Remembered between sessions
Practically every option on the form is saved when it closes and restored when it opens: the ticked listings, the input and output modes, the Excel and template options, the decimal places, the perpendicular limits, the tolerances, the counting methods and the filters. The chosen preset is remembered too, without reapplying its configuration on opening.
Two exceptions: Include signs in groups and Include signs outside groups (95, 97) always open ticked, because one of them silently off would leave part of the signs out of the report.
Notes
- Sorting by km (54) happens before the summaries, so they inherit the listings' order.
- In BricsCAD, GstarCAD and ARES Commander the form opens and all the options work, but Generate and Open reports folder are not available in this version.
- The inputs By viewport, By dwgs and By CapData are not available in this version: chosen, Generate says so on the status bar and produces nothing.
- On ZWCAD, Generate works, and so do the template buttons, Entity Report, Ver blocos, H suportes, Eliminar pontos and the whole Localizador frame. The overlap checks, Cap Att-in, Migração Seabra Sinc, the spreadsheet sync and the CapCloud tools are not available on that CAD.
- Paging the Drawn table output across several layouts with curated columns is not available in this version.
- When a ticked option is not available, the command usually says so: it appears at the end of the run, on the status bar, in the bracketed pending list. It is worth reading that list after generating.
- The status bar's pending list and the How it works tab are in Portuguese in every language.