This page covers the two commands that measure sight distance — one on the plan, one on the profile — and the steep-grade analysis that comes with the second.
| Commands | CAPCAD_ANALYTICS_HORIZONTAL_OVERTAKING (sight distance on the plan) and CAPCAD_ANALYTICS_VERTICAL_OVERTAKING (sight distance on the profile + critical grades) |
| Shortcut | none, on either |
| Ribbon | CapCad tab › Manage panel › Analytics split button › Curvas Horizontais: Visibilidade (Gabarito) and Curvas Verticais: Visibilidade e inclinações |
| Category | Analytics |
| Forms | GabaritoHorizontalForm — "Horizontal Template" · ProfileAnalysisForm — "Vertical Profile Analytics", tabs Sight distance, Grades and Util. Both are modal, and hide themselves while the command asks for selections in the drawing |
| Hosts | AutoCAD, BricsCAD, GstarCAD, ZWCAD, ARES Commander |
| What consumes the result | CAPCAD_MARKING_AXIS (Consolidated) reads the no-overtaking layers of both analyses and merges them into a single set of stretches, which becomes the signed centre line |
It answers, metre by metre, whether the driver can see far enough to overtake — and draws on the alignment the stretches where they cannot. This is the analysis that turns project geometry into a continuous line.
- The line of sight, not the radius. The question is not "is the curve tight?" but "from any point, does the line of sight to the point X metres ahead pass outside the carriageway?". The answer comes from the real geometry of the alignment and its edges.
- Plan and profile, one yardstick. A horizontal curve hides the road sideways, a vertical curve hides it over the top; both commands use the same sight-distance measure and produce stretches in the same shape, ready to be consolidated.
- The two directions, separately. Up-station and down-station are analysed in distinct runs, on distinct layers and in distinct colours: a stretch can be prohibited one way and free the other.
- The distance from the norm, not an invented number. The yardstick can come from the speed × sight-distance table, with the design speed read from the alignment itself.
- It also says how far you can see. At any point, the command returns the greatest sight distance the curve still allows — the number that goes into the report.
- Critical grades in the same window. The same window classifies every ramp of the grade line by length and gradient and inserts the warning signs at both ends of the ones that are critical.
What it does
Overtaking sight distance is the distance a driver has to see ahead to start and finish an overtaking manoeuvre safely. Where it is not met, overtaking has to be prohibited — and that prohibition is what becomes the continuous centre line.
The two commands ask the same question in different planes.
Sight distance on the plan (horizontal template)
The obstacle is the curve itself: in a curve the line of sight cuts across the inner ground before it reaches the road ahead. The command models that with two edges, one on each side of the alignment:
- it walks the alignment step by step;
- at each station it finds the point exactly one yardstick away in a straight line ahead (the intersection of a circle of that radius with the alignment);
- it draws the chord between the two points — that is the line of sight;
- if the chord crosses either edge, sight is obstructed and the station is a prohibition;
- contiguous stations are merged into one stretch, with optional filling of short gaps.
Sight distance on the profile (vertical template)
The obstacle is the crest of the vertical curve. The command works on the drawn grade line — a polyline in which X is the station and Y is the elevation:
- it walks the profile step by step;
- it finds the point one yardstick ahead on the profile itself;
- it raises both ends by the sight height and draws the line of sight between them;
- if the profile cuts that line, the crest is in the way and the station is a prohibition;
- the stretches are merged and, optionally, projected back onto the plan alignment, which is where the line will be drawn.
Both of these read the drawing, not the ground. The profile is drawn with a vertical exaggeration, and neither the sight-distance sweep nor the critical-grade test undoes it: the circle that locates the point one yardstick ahead is cast in drawing coordinates, and the ramp lengths compared against the criteria tables are the drawn 2D lengths, rise included. On a ×10 drawing a 950 m ramp at 5.5 % measures 1084 m and is classified critical against a 1000 m threshold when the real ramp is not. Read the two notes at the end of this page before you rely on a borderline result.
Critical grades
The third analysis is not about sight distance: it walks the ramps (the straight segments of the grade line) and flags the ones long and steep enough to require a warning. Each critical ramp can receive two signs, one at each end, facing the corresponding direction.
Workflow
Sight distance on the plan
- Run
CAPCAD_ANALYTICS_HORIZONTAL_OVERTAKING. The status line shows in blue that speeds are set when the project alignment carries a design speed, and in orange that they are not — in which case Detect from the defined speed (2) is disabled. - Choose the Ruler length (1) — the list holds the speed/distance pairs of the shipped table — or tick Detect so the distance comes from the alignment's speed at each point you click.
- Choose where the edges come from: fixed distance (5, 6) or selected entities (8).
- Choose the direction (9, 12, 15) and, in Alignment, whether the analysis uses the project alignment (16) or one you select (17).
- For the whole stretch, set the Step (18) and click Analyse the whole stretch (25). The form hides, the command asks for whatever is missing, and draws the stretches.
- For a single point, use Draw a standalone template (24) and click points on the alignment; each click draws the chord in green (clear) or red (obstructed). Enter or Esc ends the loop.
- To learn how far you can see at a point, use Determine the minimum admissible sight distance for a point (23).
Sight distance on the profile, and grades
- Run
CAPCAD_ANALYTICS_VERTICAL_OVERTAKING. The status line reports the state of the speeds and of the profile. - On the Util tab, enter the Start length (70) — the alignment station corresponding to the profile's first vertex — the Elevation (69) and the Vertical exaggeration (71) the profile was drawn with.
- On the Sight distance tab, set the Ruler (33), Sight height (34), Step (46) and the Direction (35, 38, 41).
- Click Full analysis (48). The command asks for the profile (a polyline with X = station and Y = elevation) and, if Plot the no-overtaking zones found on the alignment (45) is ticked, for the plan alignment too.
- On the Grades tab, choose the method (57, 58, 59), tick what to plot (53, 54) and whether you want the signs (55), and click Analyse (62).
- The selected profile is remembered while the form stays open; tick Select input (43 or 56) to pick another.
The form: Horizontal Template
The numbers on this page are unique and continuous: 1 to 31 on the Horizontal Template form and 32 to 71 on Vertical Profile Analytics.
The screenshots are of a Portuguese session, and so are the labels inside the generated figures further down; the layout, the control numbering and the geometry are identical in an English session. The English captions of each control are the ones quoted in the tables.
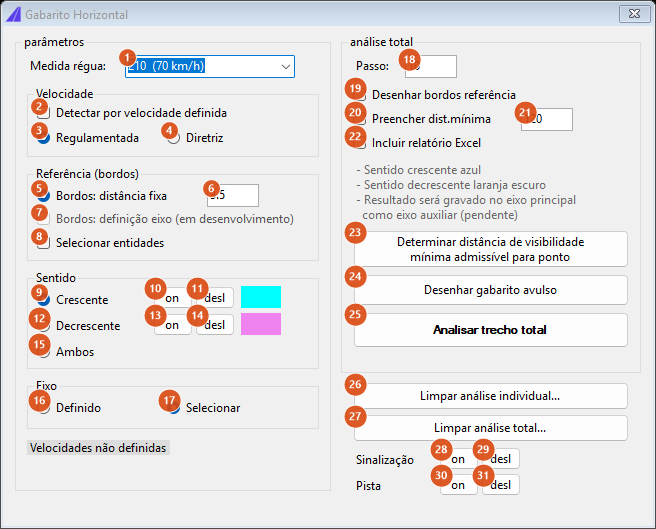
The form as it opens with no project alignment: the options that depend on the alignment are disabled and the status line warns that no speeds are set.
Parameters
| # | Control | What it does |
|---|---|---|
| 1 | Ruler length | The required sight distance, in metres. The list holds the nine speed/distance pairs of the shipped country table, from 140 m at 30 km/h up to 355 m at 110 km/h, but the field is editable: the command only reads the number at the start of the text. Default is the 70 km/h row, 210 m. Disabled while Detect is ticked. |
| 2 | Detect from the defined speed | The yardstick stops being fixed: at each point you click, the command reads the station, looks up the alignment's design speed there, converts it through the table and prints the reading on the command line. This applies to the standalone template; in the full analysis the command warns that this part is pending and uses the fixed yardstick. When the alignment carries a speed this box opens ticked; when it does not, it opens unticked and disabled. |
| 3 | Posted | Not available in this version. |
| 4 | Design | Not available in this version, like 3. |
Reference (edges)
The edges are the lines that "cut" the line of sight. They stand for the lateral obstacle.
| # | Control | What it does |
|---|---|---|
| 5 | Curbs: fixed distance | The edges are generated by offsetting the alignment itself to both sides by the value in 6. This is the default. |
| 6 | edge value | Half-width in metres used in the offset. The conservative minimum is 3.5 — the reference distance used to obtain the intersection and so decide whether overtaking is restricted. Default 3.5. |
| 7 | Curbs: alignment definition (in development) | Not available in this version. |
| 8 | Select entities | The edges come from a selection of yours — polylines, lines, arcs or splines. The command asks for the selection once, before starting, and uses the same set for both sides and for every alignment analysed. |
Direction
| # | Control | What it does |
|---|---|---|
| 9 | Increasing | Analyses looking forward, up-station. This is the default. |
| 10, 11 | on, off | Turn the up-station analysis layers on and off (ALIGNMENT_CRES_VISIBILITY_…). |
| 12 | Decreasing | Analyses looking back. |
| 13, 14 | on, off | The same for the down-station layers (ALIGNMENT_DECR_VISIBILITY_…). |
| 15 | Both | Runs both analyses one after the other, each on its own layer. Does not apply to button 23 — see the note there. |
The two coloured squares beside the buttons are the legend of the colours used in the drawing: cyan up-station, violet down-station.
Alignment (source)
| # | Control | What it does |
|---|---|---|
| 16 | Defined | Uses the project alignment. The full analysis walks every element of it, skipping those of the access type. Disabled when there is no project alignment. |
| 17 | Select | Asks for an alignment by selection. Ticked when there is no project alignment. |
Full analysis
| # | Control | What it does |
|---|---|---|
| 18 | Step | Distance in metres between analysed stations. The stretch is analysed point by point at this spacing: a smaller step gives a more precise outline and a slower run. Default 10. |
| 19 | Draw the reference curbs | Also draws the edges used, on layer ALIGNMENT_GABARITO_BORDO_REF (colour 8). Useful for checking where a prohibition came from. |
| 20 | Fill the min. distance | Two prohibited stretches separated by a gap shorter than 21 are joined into one. Without it, a gap of a few metres splits the line in two. |
| 21 | gap value | The distance in metres below which the gap is filled. Default 120. Only read when 20 is ticked. |
| 22 | Include an Excel report | At the end, opens a spreadsheet with one row per stretch: alignment, direction, start km, end km and length. |
| 25 | Analyse the whole stretch | Runs the analysis. It refuses a step ≤ 0, a yardstick ≤ 0 (with Detect off) and an edge ≤ 0 (when the edges come from a fixed distance). At the end it reports how many stretches were drawn, or that sight distance is met over the whole length. |
The stretches go to layers whose names carry the run's parameters — ALIGNMENT_CRES_VISIBILITY_<ruler>_B<edge> and the down-station pair — so that two runs with different yardsticks do not mix.
Individual analysis
| # | Control | What it does |
|---|---|---|
| 23 | Determine the minimum admissible sight distance for a point | Asks for points in the drawing and, for each, searches for the greatest sight distance the chord still clears at that point: it starts at 355 m (the top row of the shipped table) and steps down metre by metre until the chord stops crossing the edges. It writes the value on the command line and draws the chord it found on layer ALIGNMENT_GABARITO_MINIMAL. If it reaches 355 m unobstructed it reports that the distance exceeds or equals 355 and draws nothing. A point that does not project onto the alignment is reported as too far from it. It does not work with Both (15). This path always uses the ±edge offset (6), even with Select entities ticked. |
| 24 | Draw a standalone template | Asks for points and draws, for each point and each ticked direction, the chord of the yardstick: green on layer ALIGNMENT_GABARITO_OK_DIST<nnn> when clear, red on ALIGNMENT_GABARITO_PROIBE_DIST<nnn> when obstructed, with linetype SETA_CONT_1. With no project alignment the alignment is asked for once; with one, each click is matched to the nearest element, and if none fits the command says the alignment could not be identified. |
| 26 | Clear the individual analysis... | Erases everything on the standalone-template layers, after a confirmation. |
| 27 | Clear the full analysis... | The same for the full-analysis layers, with the same confirmation. |
| 28, 29 | Signing on / off | Turn the signing layers on and off (names containing _HOR_, _VERT_ or PLACA_AUX), so you can see the analysis without the project on top. |
| 30, 31 | Carriageway on / off | The same for the carriageway and shoulder layers (names containing PISTA or ACOSTA). |
The form: Vertical Profile Analytics
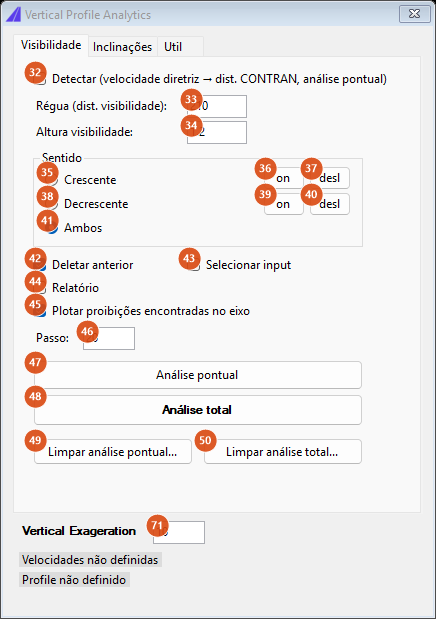
The Sight distance tab. The status area carries two lines: the alignment's speeds and the profile currently selected.
Tab 1: Sight distance
| # | Control | What it does |
|---|---|---|
| 32 | Detect (design speed → … distance, spot analysis) | In the spot analysis, the yardstick of each click comes from the alignment's design speed converted through the shipped table; the reading is printed on the command line. If no valid distance is found, the command falls back to the fixed yardstick. In the full analysis the command warns that this part is pending and uses the fixed yardstick. Opens ticked when the alignment carries a speed; without one, unticked and disabled. The caption names the table's issuing body between the arrows. |
| 33 | Ruler (sight distance) | The required sight distance, in metres. Default 210. |
| 34 | Sight height | Height of the driver's eye and of the target above the grade line, in metres. The line of sight is raised by this value at both ends. The command multiplies this height by the vertical exaggeration (71) before using it, to match the drawn profile. Default 1.2. |
| 35 | Increasing | Analyses looking forward. |
| 36, 37 | on, off | Turn the PROFILE_VISI_RESTR_CRES… layers on and off. |
| 38 | Decreasing | Analyses looking back. |
| 39, 40 | on, off | The same for PROFILE_VISI_RESTR_DECR…. |
| 41 | Both | The default. Runs both directions, down-station first. |
| 42 | Delete previous | Before drawing, erases the contents of the layer for that direction and yardstick. Ticked by default — without it, repeated runs stack overlapping stretches. |
| 43 | Select input | Forces the command to ask for the profile again, even when one is already selected in this session of the form. |
| 44 | Report | Produces the spreadsheet of stretches (direction, start km, end km, length). It only comes out when 45 is ticked as well, because the report's stations are the alignment's. |
| 45 | Plot the no-overtaking zones found on the alignment | As well as drawing the restrictions over the profile, projects them onto the plan alignment — which is where the line will be drawn. Asks for the alignment if it is not defined. Ticked by default. |
| 46 | Step | Distance in metres between stations analysed on the profile. Default 20. |
| 47 | Spot analysis | Asks for points on the profile and draws, for each point and each ticked direction, the template as a Z — the two verticals of the sight height and the line of sight between them — in red on layer PROFILE_GABARITO_VISIBILIDADE_ULTRAPASSAGEM when obstructed, in green on PROFILE_GABARITO_PERMISSAO_ULTRAPASSAGEM when clear. A point that does not project onto the profile, or a profile too short ahead, is reported on the command line. |
| 48 | Full analysis | Runs the whole sweep. It refuses a yardstick, step or height ≤ 0. At the end it reports how many stretches came out on the profile and how many were plotted on the alignment, or that no vertical sight restriction was found. |
| 49 | Clear spot analysis... | Erases the entities on the two spot-template layers. No confirmation. |
| 50 | Clear full analysis... | Erases the entities on the restriction layers of both directions and those of the critical ramps. No confirmation. |
In the full analysis, gaps shorter than the yardstick itself are filled automatically: a clear stretch shorter than the sight distance is no use for overtaking, so it does not become a permitted interval.
Tab 2: Grades
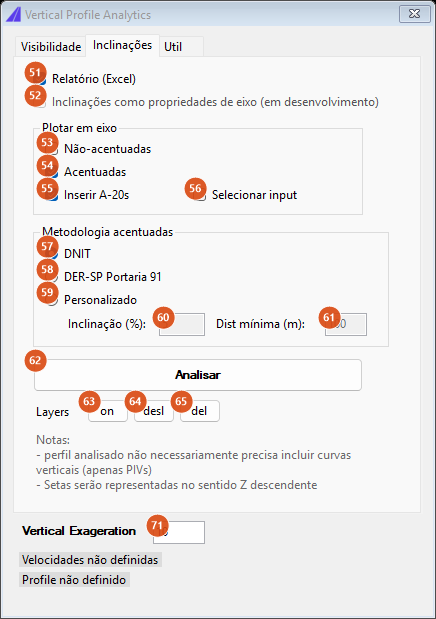
The Grades tab. The two notes at the bottom remind you that the analysed profile does not have to contain the vertical curves (the VPI polyline is enough) and that the arrows are drawn in the descending direction.
| # | Control | What it does |
|---|---|---|
| 51 | Report (Excel) | Produces the spreadsheet with one row per profile segment: position, length, radius (on arcs), gradient in %, start and end km, type (straight or curve), elevation, and a flag on the segments that are critical. Ticked by default. |
| 52 | Grades as alignment properties (in development) | Not available in this version. |
| 53 | Not steep | Also draws the non-critical ramps over the alignment, on layer PROFILE_RAMPA_<gradient> (colour 53). |
| 54 | Steep | Draws the critical ramps over the alignment, on layer PROFILE_RAMPA_SINA_<gradient> (colour 10), and over the profile itself. Ticked by default. The ramps are drawn with linetype SETA_2 and width 0.5; on uphill ramps the path is reversed so that the arrow points downhill. |
| 55 | Insert A-20s | Inserts the two signs of each critical ramp: uphill, the start-of-grade sign at the bottom and the end-of-grade sign at the top; downhill, the other way round. The signs are inserted over the alignment with a fixed offset of 8. Ticked by default. The caption and the sign names are the codes of the Brazilian catalogue on every profile — see Notes. |
| 56 | Select input | Forces the selection of a new profile before this analysis. |
| 57 | first method | The default table: a ramp is critical when its length and gradient meet one of the pairs 1000 m / 5 %, 600 / 6, 300 / 7, 230 / 8 or 150 / 9. The caption is the name of the body whose manual it implements, untranslated. |
| 58 | second method | The same table with the 5 % step at 600 m instead of 1000 m — much stricter on long, gentle ramps. Its caption is likewise a body name. |
| 59 | Custom | A single pair: the gradient in 60 and the minimum length in 61. Enables both fields. |
| 60 | Grade (%) | The minimum gradient of the custom criterion. Default 5. |
| 61 | Min. distance (m) | The minimum length of the custom criterion. Values below 20 are raised to 20. Default 100. |
| 62 | Analyse | Runs the analysis. Asks for the profile and the alignment. At the end it reports how many stretches were inserted and how many are critical, with the sign count in brackets, or that no critical stretch was found. |
| 63, 64, 65 | on, off, del | Turn on, turn off and erase the contents of the ramp layers (critical and non-critical). del asks for no confirmation. |
Tab 3: Util
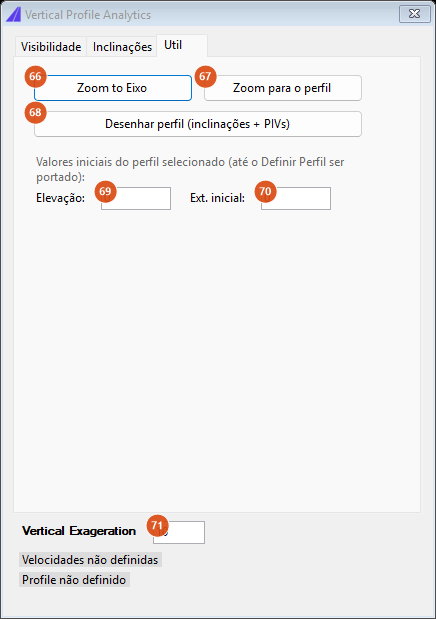
The Util tab: the two zooms, the profile annotations, and the initial values that tie the profile to the alignment's chainage.
| # | Control | What it does |
|---|---|---|
| 66 | Zoom to Alignment | Frames the alignment. Asks for it if it is not defined yet. |
| 67 | Zoom to Profile | Frames the selected profile. Asks for one if there is none. |
| 68 | Draw profile (grades + VPIs) | Annotates the selected profile: the gradient text of each ramp, aligned with it, on layer PROFILE_ANNO (colour 3), and the VPI markers on PROFILE_ANNO_PIV (colour 12). Reports how many gradients and how many VPIs were drawn. |
| 69 | Elevation | Real elevation of the profile's first vertex. It feeds the elevation column of the grade report. Default 0. |
| 70 | Start length | Alignment station corresponding to the profile's first vertex. This is what ties the profile to the chainage: without it, the stretches are projected onto the alignment from km 0. Default 0. |
| 71 | Vertical exaggeration | The vertical exaggeration the profile was drawn with. It sits outside the tabs and applies to all of them: it divides the gradients read from the drawing and multiplies the sight height. Default 10. |
Fields 69 and 70 stand in for the properties that would be stored on the profile itself; the profile-definition form is not available in this version, as the grey label says.
How the options combine
The figures below came from real runs of the sight-distance and critical-grade engines on a sample alignment and grade line. Their labels are from a Portuguese run.
The line of sight on the plan
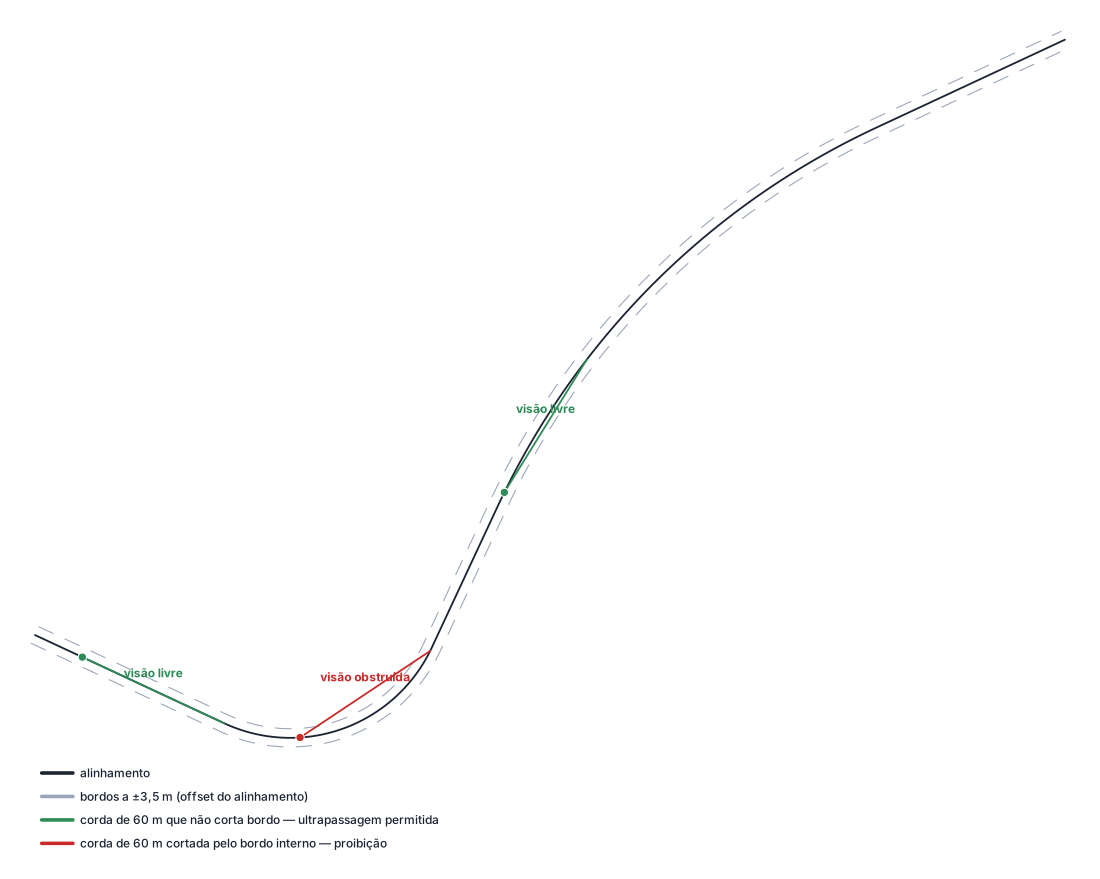
The mechanism of the standalone template, at a reduced scale so the edges are visible: alignment solid, edges dashed at ±3.5 m, yardstick 60 m. On the tangent and on the open curve the chord passes between the edges — sight clear. On the tight curve the chord cuts the inner edge — sight obstructed. On a real road the numbers are larger (yardstick 210 m, edge 3.5 m), and the ratio between them makes the edges invisible in the drawing, but the arithmetic is the same.
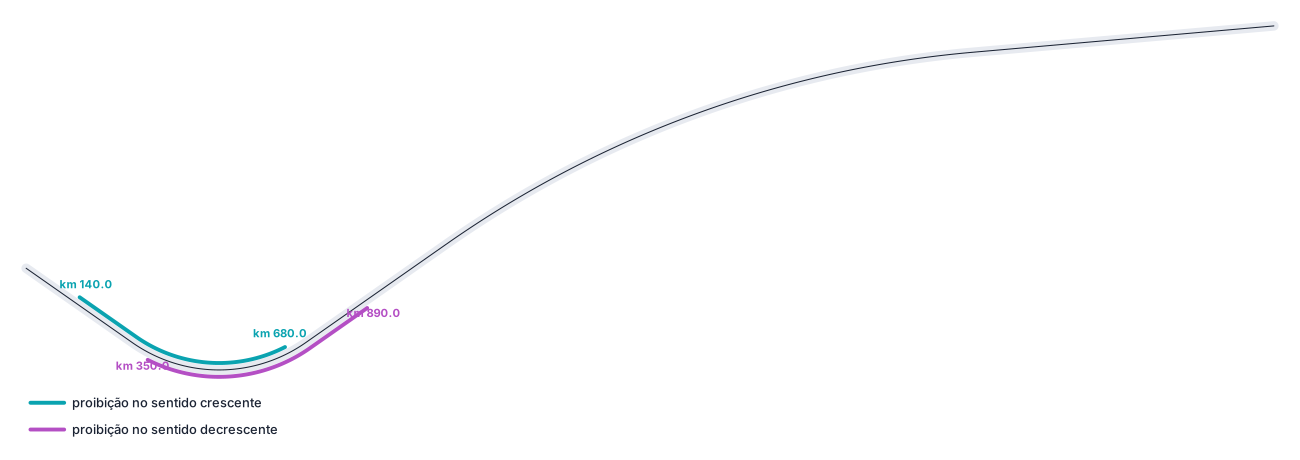
Full analysis on an alignment with one curve of R 350 m and another of R 2500 m, yardstick 210 m, edge 3.5 m, step 10 m. The tight curve produces 540 m of prohibition in each direction; the open curve, none. The two stretches do not coincide: the up-station one runs km 140 to 680 and the down-station one km 350 to 890 — each direction is prohibited before reaching the curve, in its own "before".
What the yardstick changes
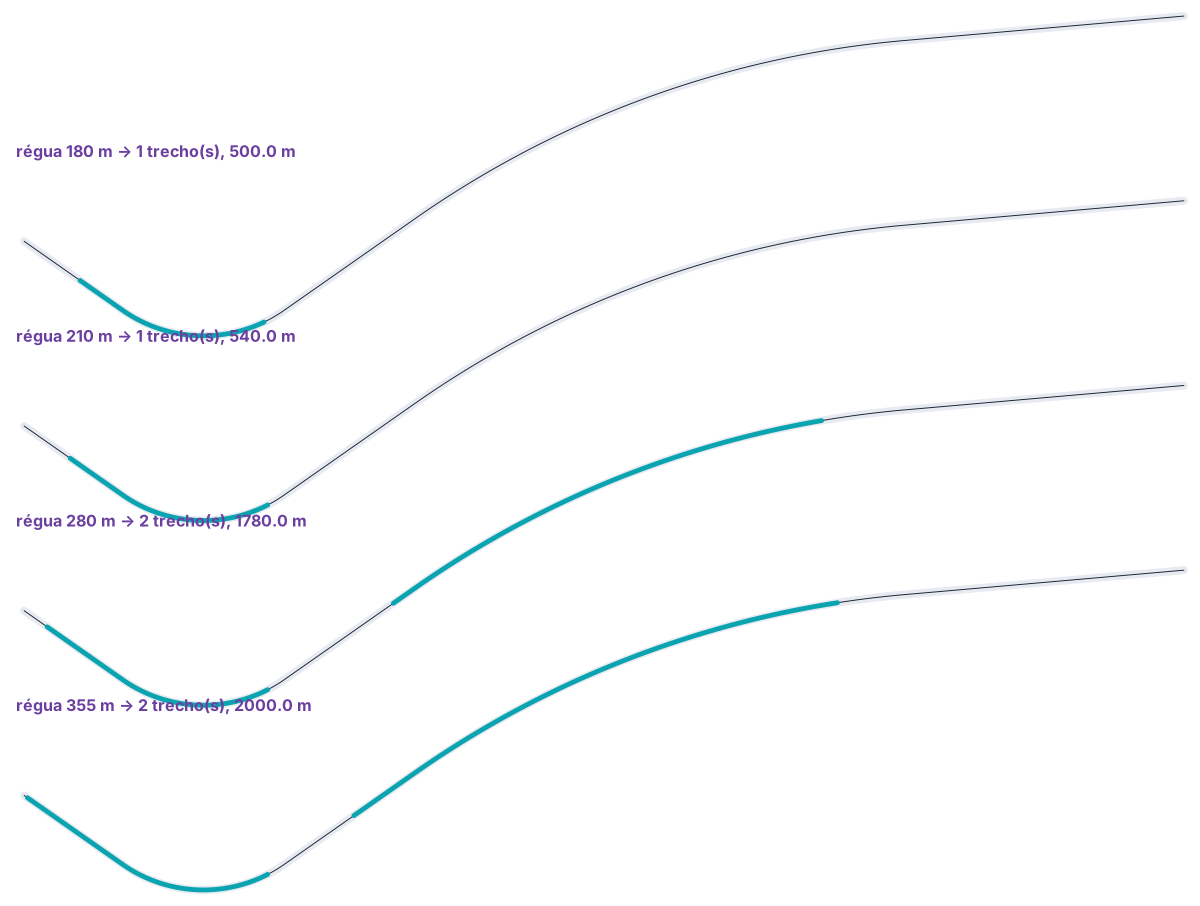
The same alignment, up-station, at four sight distances. At 180 m and 210 m only the tight curve prohibits. At 280 m the open curve starts prohibiting too and the total jumps from 540 m to 1780 m. At 355 m, 2000 m of the alignment's 2737 m are prohibited.
The yardstick is not a sensitivity knob: it is the design speed. Raising the road's class prohibits far more than proportionally.
The speed → sight-distance lookup is banded: a speed between two rows uses the lower row, a speed above the top row keeps the top distance, and a speed below the bottom row returns nothing, in which case the command falls back to the fixed yardstick. The table itself is the one of the shipped country profile and is reproduced on the Portuguese edition of this page.
How far you can see at a point
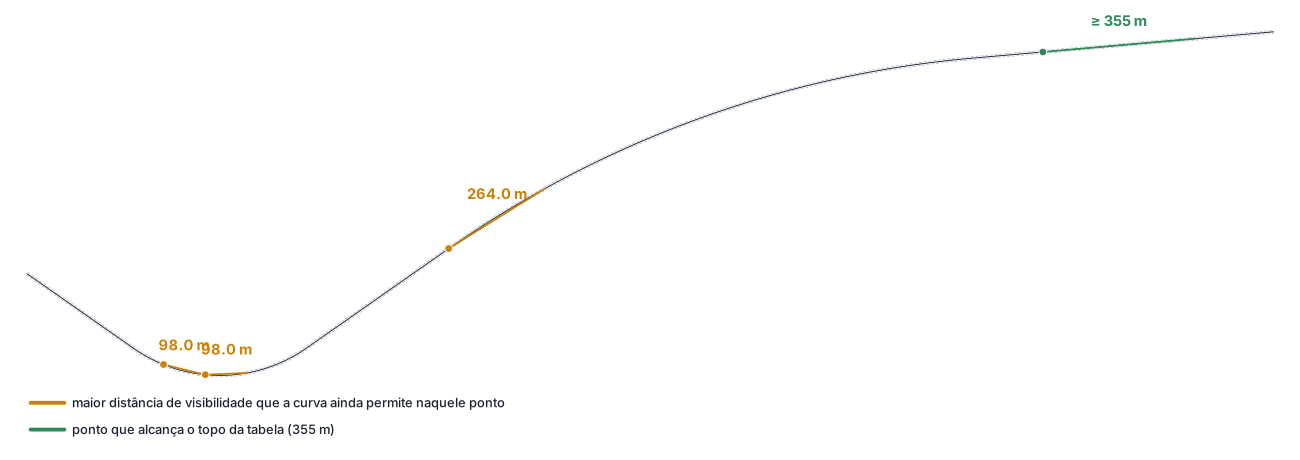
The answer of button 23 at four points on the same alignment. Inside the R 350 m curve with the edge at 3.5 m, the greatest distance the line of sight still clears is 98 m — far below the 210 m required at 70 km/h. In the R 2500 m curve it is 264 m, enough up to 90 km/h. On the final tangent the search reaches the top of the table and the command reports that the distance exceeds or equals 355 m.
The line of sight on the profile
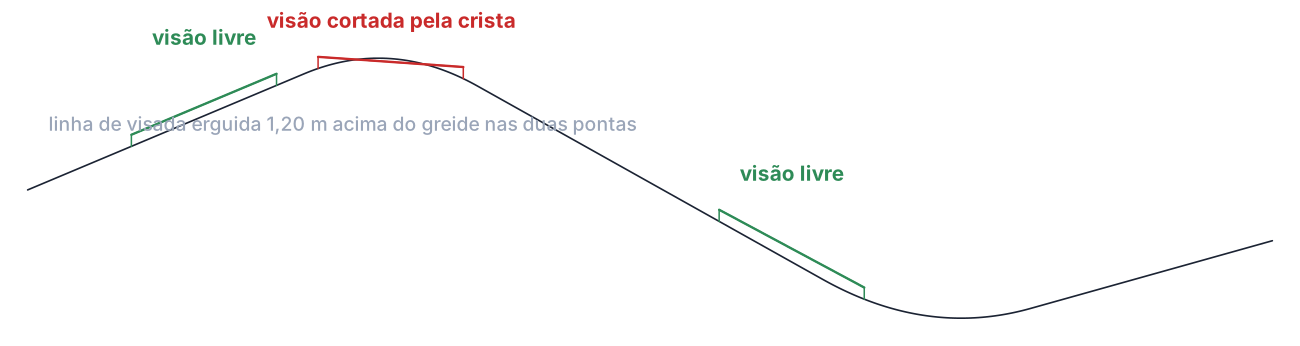
Spot analysis on a grade line with a 250 m crest between ramps of +3 % and −4 %, and a sag further on. Sight height 1.20 m, yardstick 210 m. The template is drawn as a Z: the two verticals of the height and the line of sight between them. On the ramp and on the descent the sight line passes above the grade; over the crest, the grade cuts it. The vertical scale of the figure is stretched for legibility.
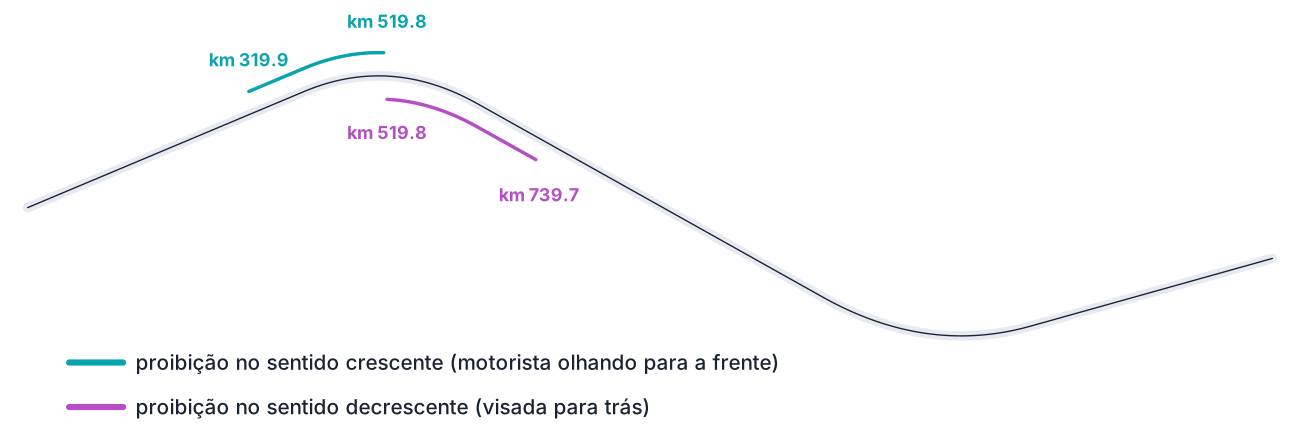
Full analysis on the same grade line, step 20 m. The crest prohibits from km 320 to km 520 for the driver going up and from km 520 to km 740 for the one going down — the two stretches meet exactly at the high point, each on the side of the driver who has not yet crossed it. The sag prohibits nothing: a sag vertical curve does not hide the road.
Critical grades
The two built-in tables differ in one row only: in the default table a 5 % gradient needs 1000 m to be critical; in the stricter one, 600 m is enough. Everything else — 600/6, 300/7, 230/8, 150/9 — is the same.
Six ramps of a sample grade line, straight from the engine:
| Ramp | Real length | Length in the drawing | Gradient | Default table | Stricter table |
|---|---|---|---|---|---|
| 1 | 900 m | 1049.6 m | −6.00 % | critical | critical |
| 2 | 400 m | 407.9 m | +2.00 % | no | no |
| 3 | 400 m | 500.0 m | +7.50 % | critical | critical |
| 4 | 200 m | 275.9 m | +9.50 % | critical | critical |
| 5 | 700 m | 798.9 m | +5.50 % | no | critical |
| 6 | 950 m | 1084.2 m | −5.50 % | critical | critical |
The column that decides is the drawing one, not the real one — see the note below. Ramp 6 is the case: 950 real metres at 5.5 % would not reach the default table's 1000 m step, but measured in the drawing, with vertical exaggeration 10, it is 1084 m and becomes critical.
Segments shorter than 10 m in the drawing are ignored, and segments with curvature (the vertical curves, when the profile carries them) enter the report with their radius only, without a gradient or a verdict.
The figures that show the two criteria tables and the classified ramps are labelled with the two bodies' names and with the sign codes, so they are not reproduced here.
Remembered between sessions
Nothing. Both forms are built from scratch on every run: yardstick 210, height 1.2, step 10 (plan) and 20 (profile), edge 3.5, exaggeration 10, the default grade table, direction Increasing on the plan and Both on the profile.
What survives is only within a run: the profile form keeps the selected profile while it stays open, and the horizontal template keeps the edge selection during the full analysis.
What stays in the drawing is the real memory: the analysis layers carry the yardstick and the edge in their own names, and that is how an old analysis is told apart from a new one.
Notes
- The profile analysis runs in drawing coordinates. The circle that locates the point one yardstick ahead is cast over the already-exaggerated profile, so the distance measured is the one on the paper, not the one on the ground. With vertical exaggeration 10, a 4 % ramp becomes 40 % in the drawing and the effective yardstick shrinks by a few per cent. The greater the exaggeration and the steeper the ramp, the greater the difference; on a grade line of gentle ramps it is negligible.
- Ramp lengths are measured in the drawing. The critical-grade criterion compares the 2D length of the drawn segment — which includes the exaggerated rise — against the table's steps, not the horizontal projection. On a 5.5 % ramp with exaggeration 10, the measured length is about 14 % greater than the real one. When checking a borderline result, use the length column of the report and not the distance between the stations.
- Detect does not apply to the full analysis, in either command. The speed-driven yardstick only works on the point-by-point paths (standalone template and spot analysis). Tick it and run the full analysis and the command says on the command line that the part is pending, and uses the fixed yardstick. For an alignment with stretches at different speeds, run the full analysis once per stretch, with each stretch's yardstick.
- The full analysis on a selected alignment runs one direction only. With Select (17) ticked, the analysis uses the state of the Increasing option (9) alone: ticking Both does not expand to the two directions on that path. With the project alignment (16), Both works normally.
- The minimum admissible distance ignores the edge choice. Button 23 always generates the edges by offsetting ±value (6), even with Select entities (8) ticked — for speed, since it repeats the calculation up to 355 times per point.
- The critical-grade signs are those of the Brazilian catalogue on every profile. The check box caption spells one of them out, and on another country profile the command still asks for those two blocks.
- Neither analysis writes anything onto the alignment. The result is drawing: entities on the prohibition layers. It is
CAPCAD_MARKING_AXIS(Consolidated) that reads those layers, merges the two directions and stores the consolidated stretches on the alignment. The horizontal template's status line says as much when it finishes: writing to the alignment is pending. - A few labels are untranslated. The two grade-method radios, the label above the vertical-exaggeration box and the profile window's title keep their original text in an English session.
- For the classification of the same curves into sharp and signable, and the curve-warning signs, see Curve Utilities. For sign-support heights, see Vertical signage management.